- Despite Reflation Trade talk, big tech continues to outperform
- Global COVID resurgence fuels market worries
The powerful economic recovery narrative that's been driving markets higher received an additional boost on Friday from the latest US Manufacturing and Services PMI releases as well as from the March new home sales print. All beat expectations, with the home sales figures blowing analyst expectations out of the water. As a result, the Dow Jones, S&P 500, NASDAQ and Russell 2000 all gained to close what had been a volatile week of trade.
Though a number of the major indices are now just marginally below new record highs, the choppy trading last week, as equities whipsawed between optimism on the accelerating economy and pessimism on rising COVID-19 cases in some locations globally, left the SPX with a weekly loss of 0.1%, the NASDAQ -0.3% for the week and the Dow down 0.5% over the same period. However, with Friday's trade solidly in green territory, signs point to stocks resuming their rally in the week ahead, lifted by more strong economic data and positive earnings releases as some of the market's marquee names, including Microsoft (NASDAQ:MSFT), Apple (NASDAQ:AAPL) and Amazon (NASDAQ:AMZN) report.
Reflation Trade Continues To Lag
US new home sales not only beat expectations, they rose to the highest level for the metric since 2006. Though this certainly provides credibility for the economic recovery story, investors would do well to remember that the last time this measure was so high it ended up being the prelude to the the popping of the US housing bubble, which then crashed resoundingly. Though some blamed the Fed for easing policy, cutting interest rates from 6.5% to 1.0% at that time, former Fed Chair Alan Greenspan, laid the blame elsewhere.
Both the S&P 500 and the NASDAQ Composite hit new all-time highs intraday, but failed to retain gains and therefore did not score new record closes as the trading week wrapped up.
Last week’s market dramas were, in our opinion, a gross overreaction to some profit-taking amid strong equity performance. Three of the four indices traded along continuation patterns. The NASDAQ 100 easily outperformed the other benchmarks, gaining 11.25% since the Mar. 25 low.
In particular, it bested benchmarks that represent the other side of the Reflation Trade, especially the Russell 2000, which gained just 8.6% over the same period. This is surprising given all the talk about a cyclical rotation into value shares. For all that, big tech stocks are still leading.
On the other side of the scale, the small cap index is showing potential technical weakness.
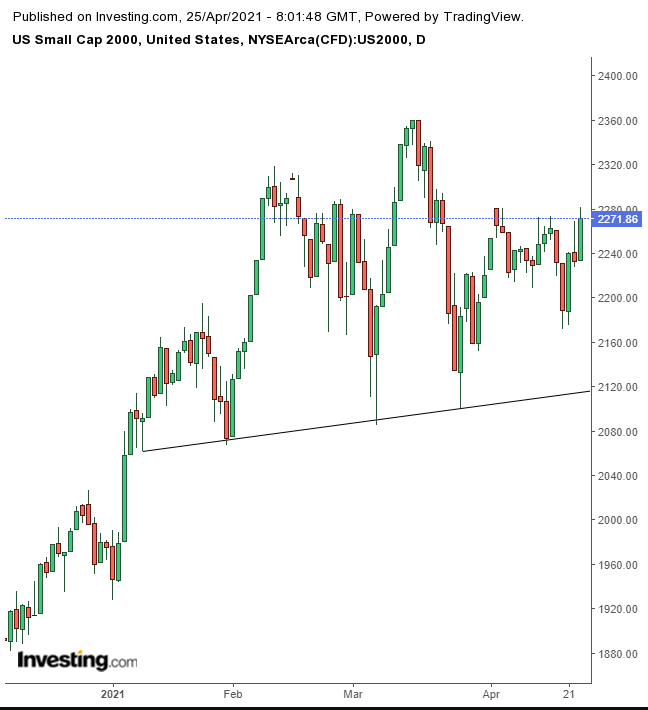
The Russell 2000 is still subject to a possible H&S top.
On the final day of last week's trading, Financials outperformed, (+1.9%). That's the sector that would most directly benefit from higher interest rates and could therefore, arguably be considered the Reflation Trade poster child. However, Technology was the second best performing sector, (+1.5%), dispelling an obvious theme on Friday. In fact, except for defensive Consumer Staples (-0.25%) and Utilities, (0.1%), the remaining 9 sectors were all comfortably in the green (at least half-a-percent).
Also, over the past week, it wasn’t clear that cyclicals or growth sectors were running the show, with Real Estate (+2%) and Health Care (+1.8%) stocks—which don’t comfortably fit into one category or the other—clearly in the lead. The message was otherwise mixed: the additional two sectors in the green for the week were Industrials (+0.4%) and Materials, (+0.3%), which would both benefit from economic rebuilding, while Technology (-0.4%) and Communication Services (-0.5%) were in the red even though Tech shares came out ahead on Friday.
To be fair, in the sector comparison since the recent Mar. 25 bottom, for the month, Technology (+8.9%) was slightly overshadowed by Materials (+9%), while Communication Services (+1.5%) was the second-worst performer after Energy, (-0.6%), the only sector in the red during that timeframe.
Along with the pandemic, which saw a resurgence in some developing countries, including a new daily global record that happened to occur in India where there were more than 300,000 new cases detected in just one day, stocks will face another headwind from the Biden Administration which is expected to propose nearly doubling the capital-gains tax for the wealthiest top 0.3%, Americans earning over $1 million.
The White House also wants to increase the corporate tax rate from 21% to 28%, narrowing Former President Donald Trump’s cut in 2018.
All this isn't a surprise to investors, of course. It was part of candidate Joe Biden’s election platform. What's not clear is whether this is just a beginning bargaining postition or something more. Thus it's unclear at this point how much of an impact this will have on markets.
Historically, according to FactSet, stocks kept rising after capital gains tax hikes in 1969, 1976 and 1986—to an average escalation of 28% in two years after each of these hikes. At this point, the Fed seems to have the most power to influence the rise and fall of asset prices.
Note that we’re not expecting the market to crash, but we do anticipate violent shifts in stock and sector favorites depending on how traders and investors view the state of the domestic and global economy as well as the global and regional health situation. As well, inflation has been a guiding light that has led stocks and the dollar higher.
While wondering how much spikes in data, including inflation, will impress investors, it's also important to remember that it’s easy to show amazing results after the economy was at a standstill over portions of the past year. Equally significant, once the economy fully reopens, all metrics should be expected to temper.
For now, an improving labor market will increase household consumption. With the continued Fed promise of support, improving vaccine rollouts in Europe, and a consistent and powerful rebound in corporate profits of most S&P 500 firms, investors will likely be increasing risk, per the continuation patterns that have been developing on the charts.
Falling yields—including for the 10-year Treasury note—demonstrate that investors don’t think inflation will rise significantly enough to raise rates, after the Fed has repeatedly argued that accelerating rates only mean confidence in the recovery.
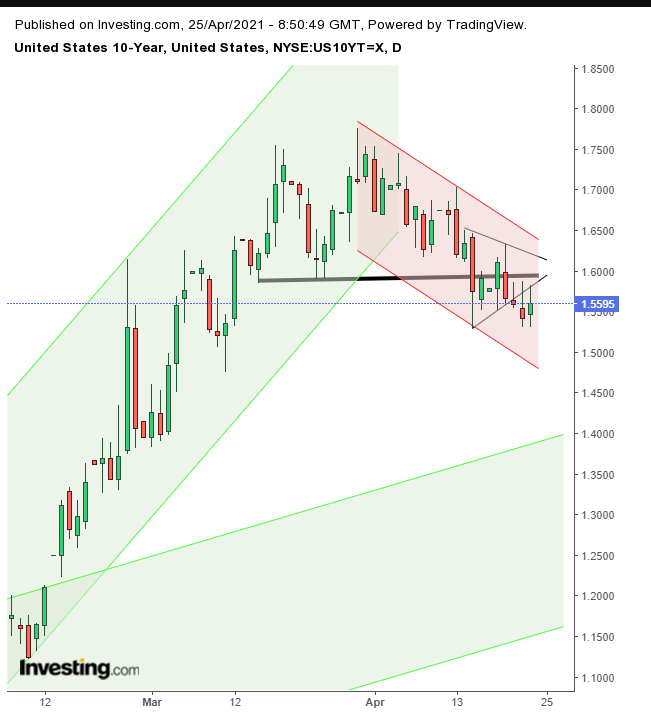
Yields completed a bearish pennant, after completing a top, setting a downward trajectory toward 1.4%.
The shift in rate expectations left the dollar hanging after it completed a rising wedge.
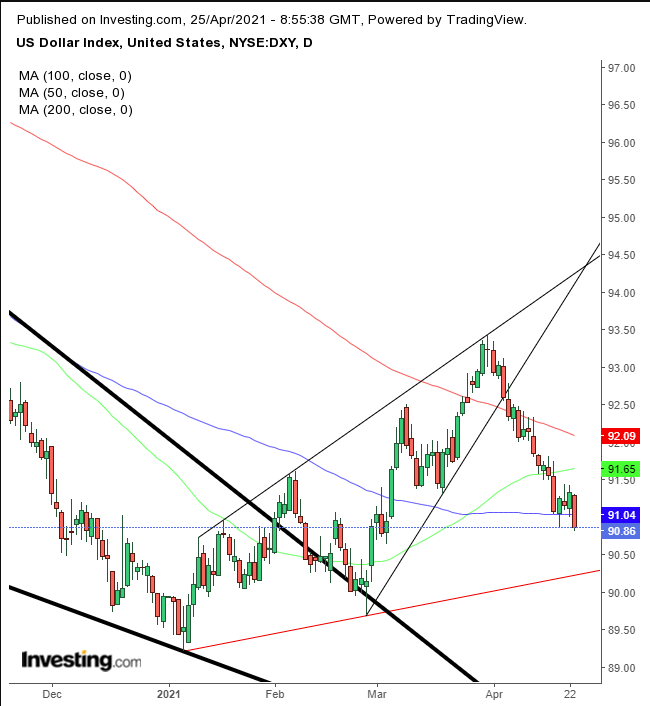
This pushed the greenback below all the main moving averages, the last one being the 100 DMA on Friday, to a near-8 week low. Note, that the 50 DMA just came the closest to the 200 DMA since falling below it in July, a sign of a likely explosive move to follow, as the price nears the expected support of the massive falling wedge since the March peak.
Gold fell for a second day as rising yields provided a more attractive safe haven.
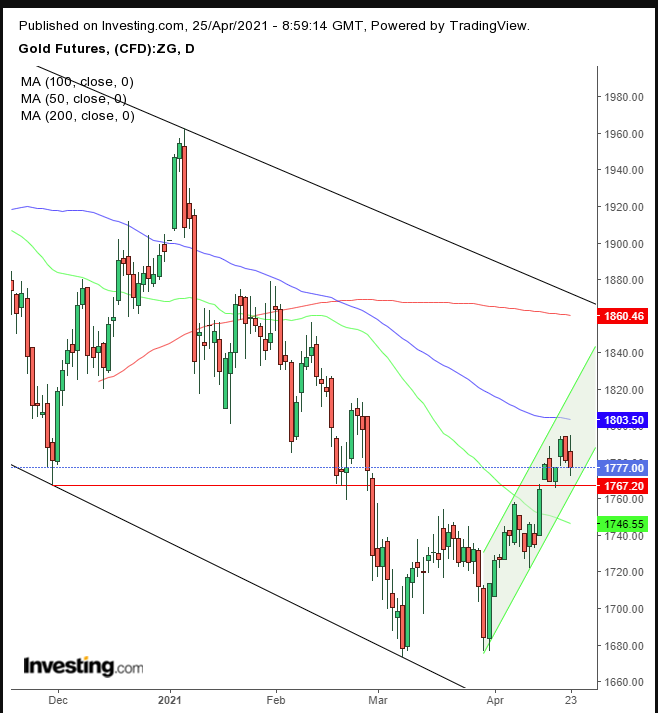
The yellow metal has completed a small double bottom within what is considered to be a corrective move toward the top of its falling channel since the March peak...in mirror image to the dollar.
Social media has been wild with enthusiasts and traditionalists having their say about Bitcoin’s recent volatile moves.
Clearly, retail traders, particularly those young and inexperienced enough to have never really seen a significant bear market, don’t understand that any asset has its ebb and flow. Moreover, when an asset has a powerful ebb, as is the case with this highly volatile cryptocurrency, one should expect an equally powerful flow.
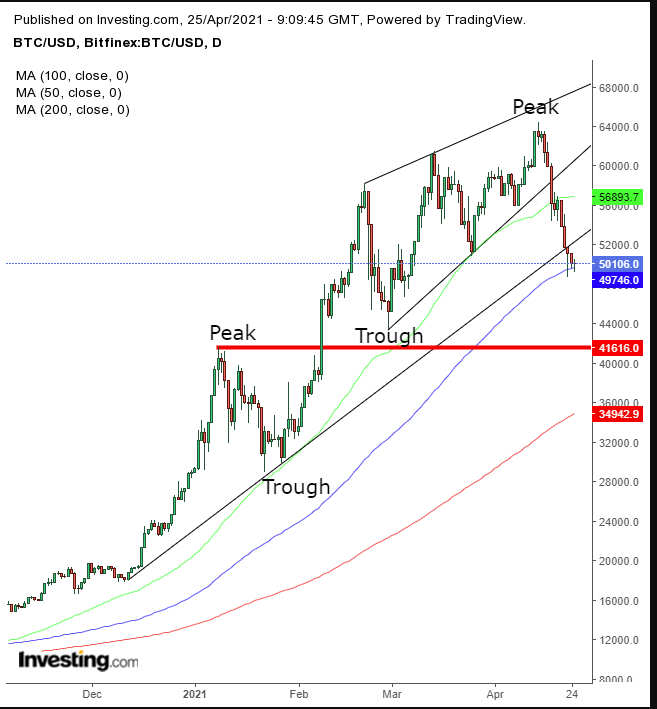
Bitcoin found support for the third day above its 100 DMA, after Friday’s hammer. However, the bullish candle only formed after the price already fell below the uptrend line since the December low, which may mean it will likely deepen its slump.
Still, the digital token remains in a long-term uptrend channel, and Fundstrat Lead Digital Asset Strategist David Grider thinks this pullback could be a step back before a leap to $100,000. In our view, $45,000 would afford an attractive buy, from a risk-reward perspective.
Schlumberger (NYSE:SLB), the world’s largest oil and gas equipment services company, predicted a gradual recovery for crude. The weakening dollar boosted the energy commodity on Friday.
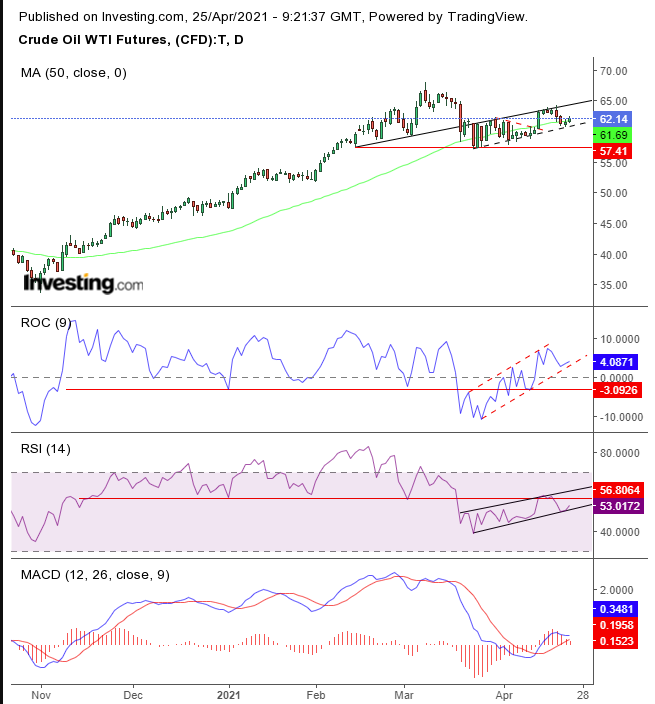
From a technical perspective, WTI has been running two contradictory formations. While it has blown out a bearish pennant, the price fell last week after finding solid resistance by the failed, recent uptrend line. If the price won’t stay above its new narrower rising channel, which it's now threatening to topple, it will likely retest the $57 levels.
The same inconsistency is visible in its other indicators, with two different momentum gauges providing two different readings. While the ROC blew out the neckline of a would-be top, the RSI is still below its resistance. After the MACD bottomed, it's now waning.
The Week Ahead
All times listed are EDT
Monday
4:00: Germany – Ifo Business Climate Index: seen to rise to 97.8 from 96.6.
8:30: US – Core Durable Goods Orders: expected to climb to 1.6% from -0.9%.
21:54: Japan – BoJ Interest Rate Decision: forecast to remain steady at -0.10%.
23:00: Japan – BoJ Monetary Policy Statement, Outlook Report
Tuesday
11:00: US – CB Consumer Confidence: likely to advance to 112.1 from 109.7.
21:30: Australia – CPI: predicted to remain flat at 0.9% QoQ.
Wednesday
8:30: Canada – Core Retail Sales: anticipated to surge to 3.7% from -1.2%.
10:30: US – Crude Oil Inventories: printed at 0.549M bbls last week.
14:00: US – Fed Interest Rate Decision: the central bank is expected to hold steady at 0.25%.
14:20: US – FOMC Press Conference, FOMC Statement
Thursday
3:55: Germany – Unemployment Change: to move to -10K from -8K signaling a positive change.
8:30: US – GDP: forecast to jump to 6.5% QoQ from 4.3%.
8:30: US – Initial Jobless Claims: expected to rise to 560K from 547K.
10:00: US – Pending Home Sales: anticipated to surge to 6.0% from -10.6%.
21:00: China – Manufacturing PMI: seen to edge down to 51.7 from 51.9.
Friday
2:00: Germany – GDP: to plunge to -1.5% from 0.3% QoQ.
5:00: Eurozone – CPI: will probably climb to 1.6% from 1.3% YoY.
8:30: Canada – GDP: expected to slip to 0.5% from 0.7% MoM.
