Week Ahead
With the coronavirus continuing to dominate market attention, the focus next week will turn to the preliminary PMIs for April as investors try to gauge the extent of the economic disruption caused by the virus. But I must caution with the nature of this stay at home environment survey-based economics has been less reliable given the full range of forecaster expectations. However, the prints could still provide poor optics none the less.
As usual Initial weekly jobless claims from the US will also be a focal point, along with the Ifo business climate indicator from Germany. US job losses have looked a little worse than most expected, but it is too soon to tell whether losses happened earlier than they anticipated or are worse.

Company earnings will be competing for headlines too, with 88 S&P 500 companies reporting next week, although the poor messaging from corporate America so far has failed to dent sentiment, and there is nothing to suggest next week will be any different.
On the political side, EU leaders will be meeting via webcam as they discuss their response to the pandemic, while negotiations between the UK and the EU continue.
Across the pond (in Europe), the preliminary PMIs for April on Thursday will be in focus. If you thought the March readings were terrible, well buckle in as there's the stinky possibility that the numbers will get even worse in April, as many economies hadn't fully locked down yet when the March surveys were taken.
For example, in Italy, where the lockdown covered the entire March survey, their services PMI fell to a horrifically low 17.4, which gives you an indication of how far these can fall given the current conditions.
But the US PMI may be the key, as their PMI numbers held up comparatively well relative to Europe in March. Their composite PMI only fell to 40.9, which was some way above the Euro Area's composite reading of 29.7
The question will be whether the US data will converge to the low end of the spectrum as US states issued stay-at-home orders in late March and early April, the effects of which will be picked up by this month's surveys.
In Asia, like the rest of the world, market participants will continue to pay close attention to the COVID-19 curves. At the same time, the focus will probably fall on two vital economic prints.
Analysts expect South Korea's GDP growth to fall to 0.4%yoy in Q1, from 2.2% in Q4. On a QoQ basis, the economy probably contracted by 2.3%, led by a contraction in domestic demand amid the COVID-19 outbreak.
Its widely expected that Thailand's exports to drop further, by 5.5% in March, vs. a 4.5% contraction in February.
Trading Outlook
The debate over the "shape" of the US recovery, "L" - "U" - "V" or W is a total distraction given that this is a policy-driven not an economically induced recession and is nothing like we've seen before, let's just stop the nonsense and conceded that the recovery would probably be a mix of these letters and will likely be as consistent as a bowl of alphabet soup.
Still, I can't grasp the constant references to previous bear markets and the " experts" why buying stocks is a bad idea. This slowdown is unlike anything before and is irrefutably and structurally different than any bear market on record. Imbalances in the world economy did not cause this mess. This meltdown was a deliberate policy-induced slowdown, so the pattern of recovery will be nothing like before and probably a lot more explosive at times. However, there will be numerous air-pockets to navigate.
The one sector of the economy that we should all be concerned about is the Airline industry to which we could deconstruct a perfect parallel to the aftermath of 9-11 when the industry was left in tatters. Ok, a virus is not a terrorist attack, but it shares similar characteristics. Passengers may be willing to get back on a plane quicker than after 9-11. But businesses have now invested in webcam technology, and everyone seems very comfortable with it, so there could be a huge drop off on business travel.
Currency Markets
If truth be told when it comes to calling the currency markets these days, I feel more like a weather forecaster, sure it is straightforward to predict the next few days, but the accuracy falls off significantly after five.
Australian Dollar
My basic strategy right now is to back the corona divergence trade proxies piggybacking the China recovery.
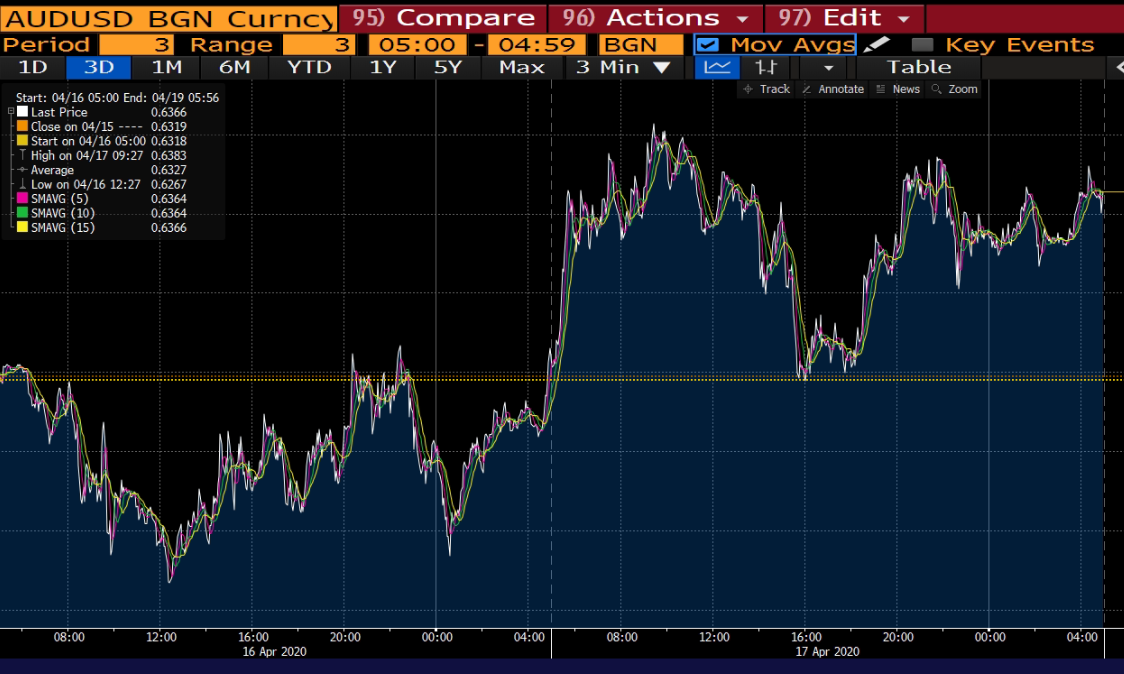
The Australian dollar continues to stand out as a non-consensus view as it could gain a lot on a China recovery as the demand for Australia's critical export iron ore increases. But what I also like is that positioning is very short due to CTA involvement that has all 12 strategies running 95 % short, and the first watch target is at .6450. If these stop losses get triggered, AUD/USD could ride the express elevator higher.
But the thorn in the commodity block side is oil prices, and for the Aussie specifically, it's the yo-yo risk sentiment since the AUD' has a high beta correlation to the S&P 500 that made things testy also.
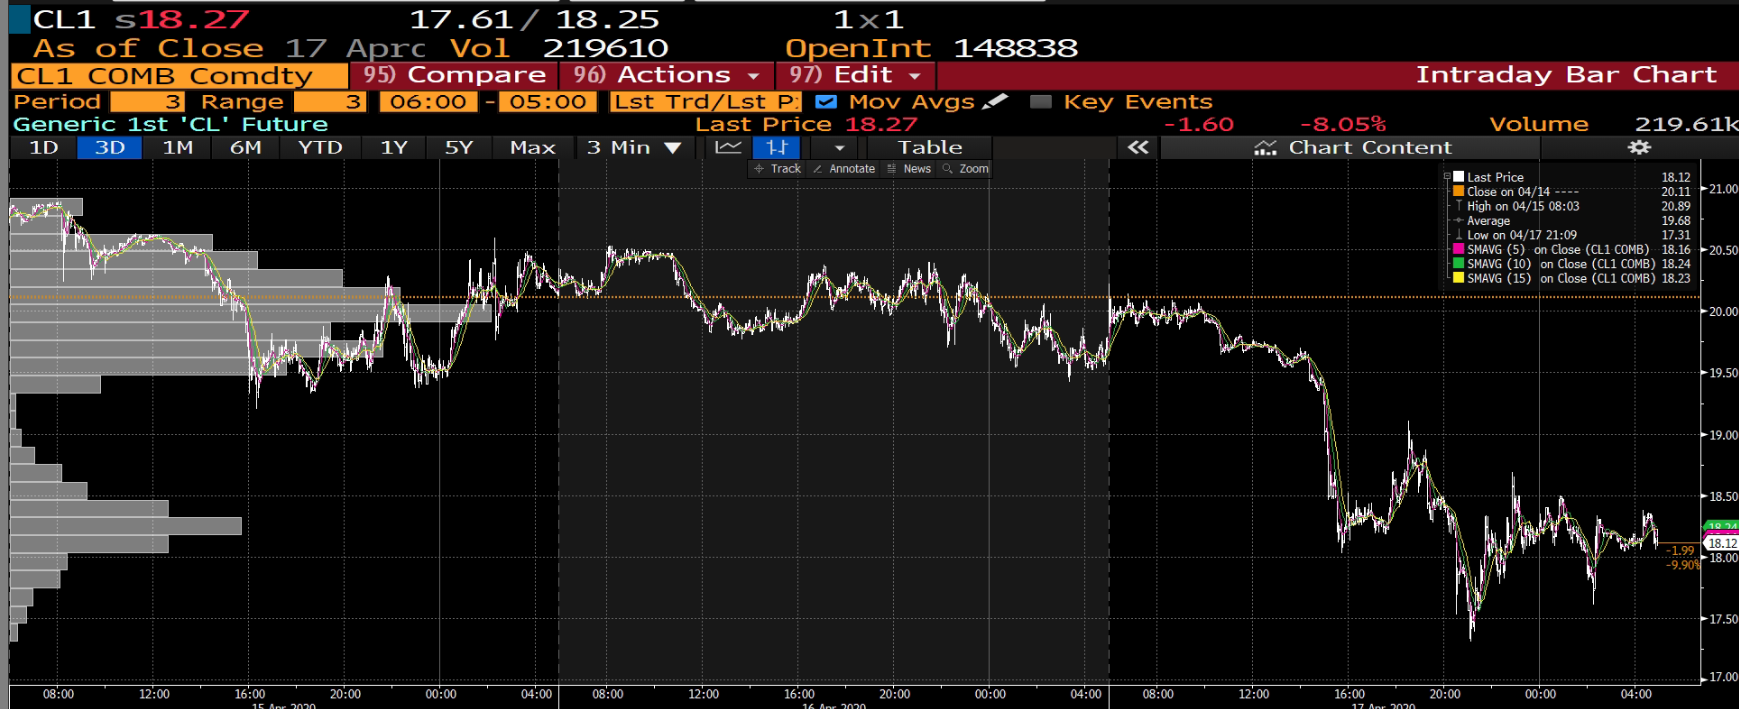
Ultimately, I think oil will be much less of a driver in the market psychology as people get used to NYMEX trading at $20, which should eventually leave the Aussie tethered to risk sentiment and the China rebound. When lights turn on in China, and if the SPX500 moves back to 3000, which I firmly expect it to, you may look back at AUD/USD in the 63's handle with nostalgic longing.

Trading S&P Futures Via Forex
I have been doing this off, and on the past two weeks strictly on an algorithmic basis with decent results, it's not a new strategy by any means but let me shed some light using CFDN on to both illustrate and draw data for

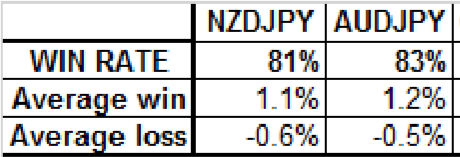
If you are a good stock picker and do as I do, stick to the AUDJPY and NZDJPY, which are the best in the show on this trade anyway, the table below shows how you would have done if you were right on S&Ps, and you expressed it in FX. For example, if you were short, NZDJPY and stocks went down those counts as a win and assuming a primary 2:1 stop-loss ratio strategy. So, you would be having a pretty good time trading this basket in correlation to the S&P 500

Oil Markets
It took mere days for the market to recognize that the OPEC+ deal will not, in its present form, be enough to balance oil markets. Brent had recovered slightly from this week's lows but is still down about 15% relative to last Thursday's close and about 22% from the highs last Friday when OPEC+/G-20 optimism was at its peak.
On the surface and over time, the deal should prove to be more important as a signal of the end of the Saudi/Russia price war and the free market experiment for reducing oil supply, and we already see a willingness to go above and beyond the terms agreed to stabilize the oil price which are holding the bears at bay.

Energy Ministers of Russia and Saudi Arabia have released a joint statement hinting at further production cuts to come. And while it probably a day late and a barrel short of offsetting the massive imbalance expected in 2Q, additional cuts could quicken the narrowing of supply and demand into H2. Still, this will do little to reduce the downside risk near term. Still, there are signs of coordinated action that could mean a brighter look in heading into Q3 but holding long term oil positions are expensive due to the steep contango, which is merely a reflection of the enormous cost to store oil. So, for the next little while oil will trading will be mostly a whippy intraday affair, be careful to leave stops tight to the markets ATR's so you don't get caught offside on any headline risk.
Gold Markets
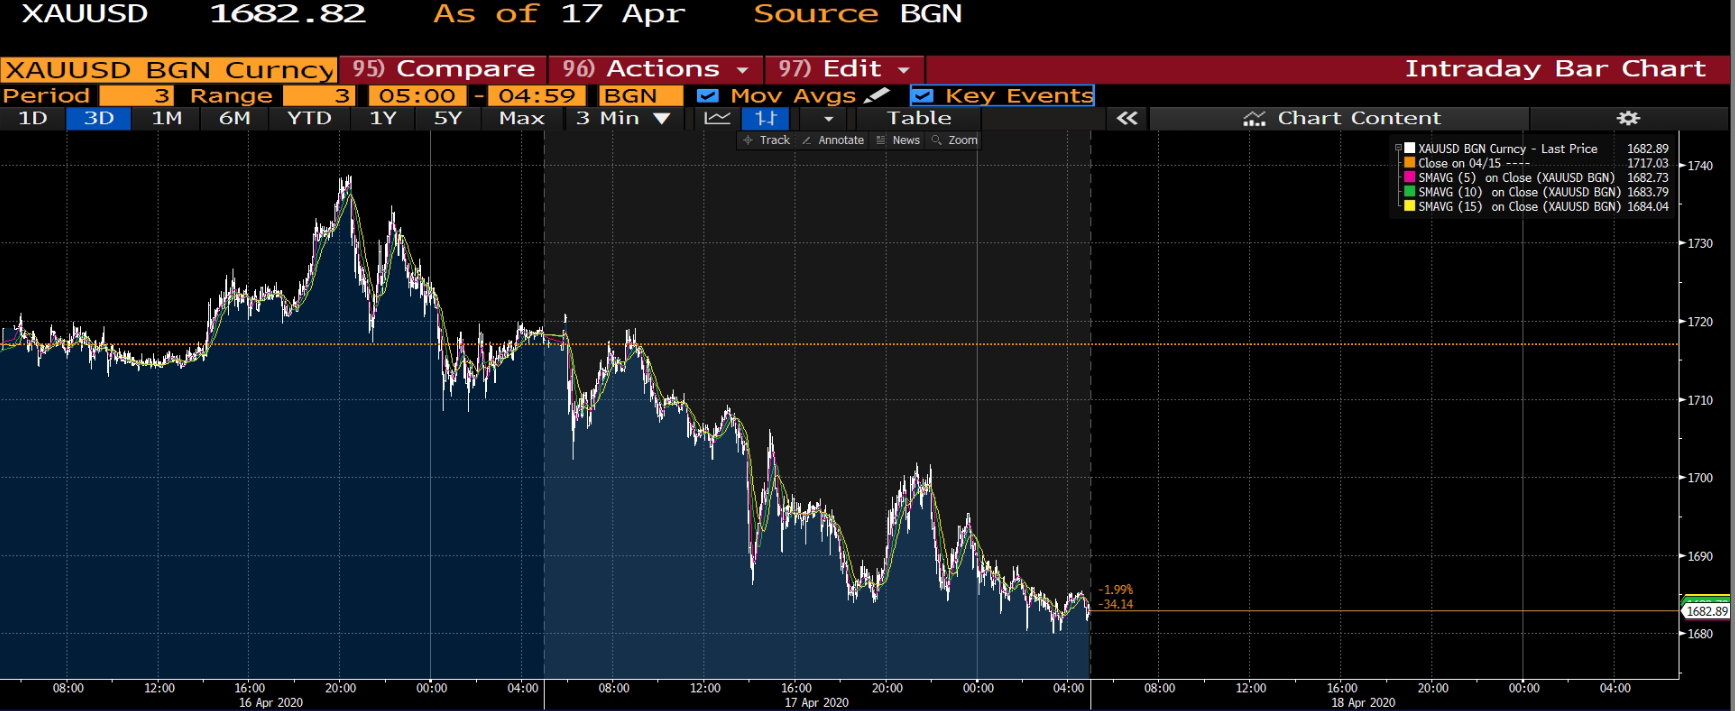
Gold lost some support by the release of the US plan for exiting lockdown measures combined with news of progress in finding a treatment for COVID-19. The lack of fresh buying, in turn, encouraged profit-taking, and gold was on the defensive for the rest of Friday.
As we indicated on Friday Asia morning note, Institutional Gold bids are pulling back to the $1650-75 oz levels on a more optimistic near-term economic outlook takes hold after President Trump has introduced a workable roadmap to recovery. And while there was some intermittent support once stops at $1700 were triggered gold fell to $1680 level just above those chunky strategic gold buyer bids.

The prospect of an end to the lockdowns in the US is impressing risk markets and triggering a modest liquidation on gold. Equity traders are sprinting to their "America First" playbook. The MSCI USA Index is trading near a record two-decade high versus the rest of the world. If US equity markets continue to push higher, and the SPX500 puts in some headroom above 2900, gold may tumble below $1650 as hefty positions built above $1675 could head for the exits.
