Stocks may be showing no sign of slowing down: the Dow Jones, S&P 500 and NASDAQ all finished the trading week at record highs. Nevertheless, an array of red flags should keep investors in check.
Gold, perhaps the ultimate safe haven, moved higher on Friday, even though equities and the U.S. dollar also advanced. As concerning, a well respected sentiment tracker measuring levels of investor euphoria reached an extreme position.
Diminishing Trade Tensions, Central Bank Stimulus Boost Equities
European stocks also ended the week with another record, their fourth straight, no doubt fueled in part by positive data from the world’s two largest economies. Additionally, easing trade tensions against a backdrop of central bank stimulus and a Fed that’s committed to staying on hold seem to have left investors with little choice but to keep bidding equities higher.
The S&P 500 and NASDAQ Composite each notched their eighth straight record. For the 30-component Dow, it was the fourth consecutive all-time high.
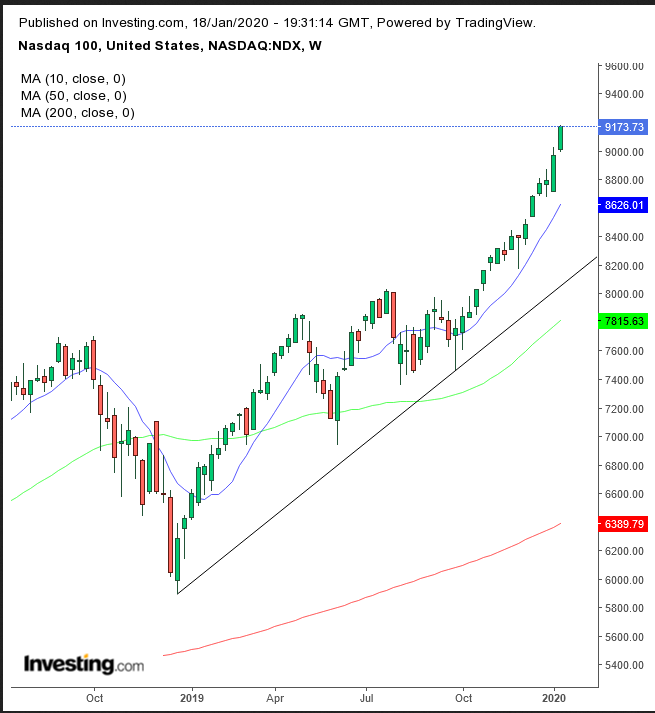
The NASDAQ 100 climbed for its sixth straight week, crossing over the 9,000 level for the first time in its history.
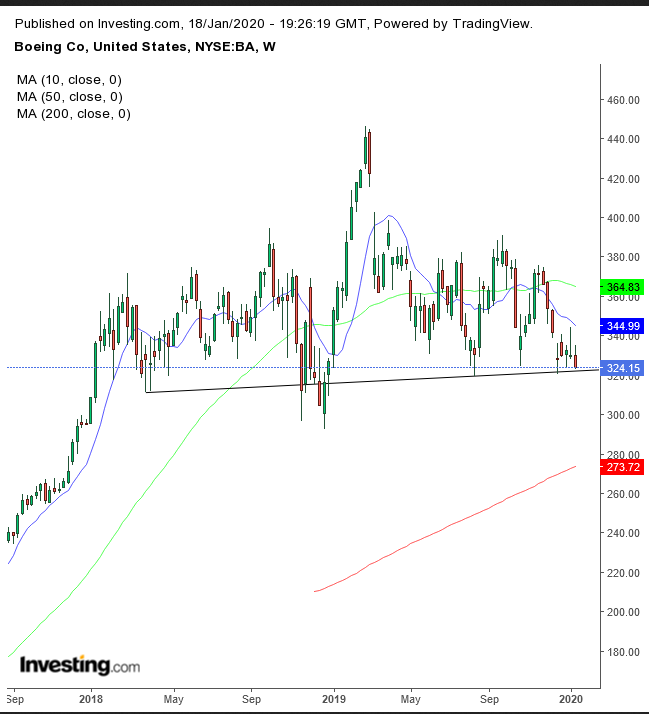
Conversely, Boeing (NYSE:BA), the U.S.'s beleaguered aeronautics giant, closed well off its highs, with shares plunging to their lowest since Aug. 14, after Fitch downgraded the stock to A- from A. The move was due to a report of the discovery of new software flaws, further extending the grounding of the company's 737 MAX.
Technically, the stock inched toward completing a top.
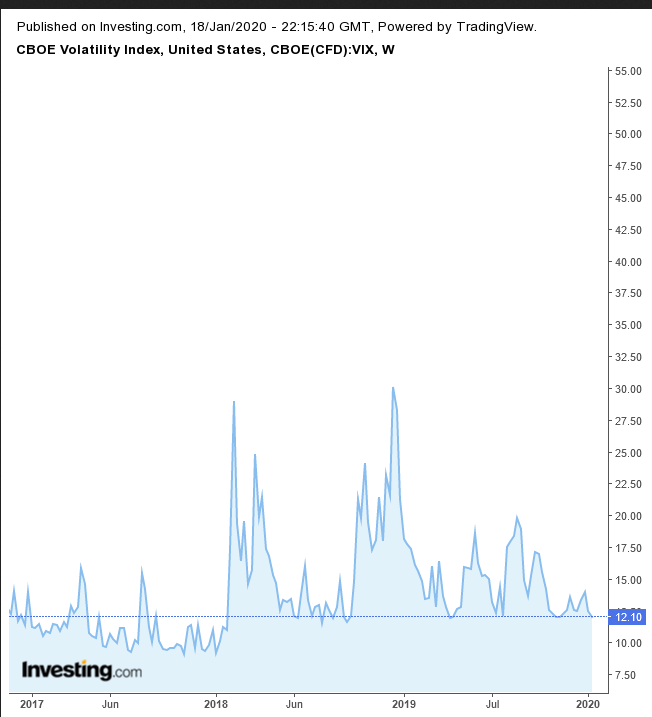
The VIX volatility index is hovering just above the April low, right before the S&P 500 fell 7%. An inch below that, the VIX’s September low preceded the S&P falling as much as 20%.
The Russell 2000 retreated from its highest level since Sept. 20, 2018 to just 1.5% from its Aug. 30 record. The small cap index slipped beneath the 1700 mark, about 2.4% under the record.
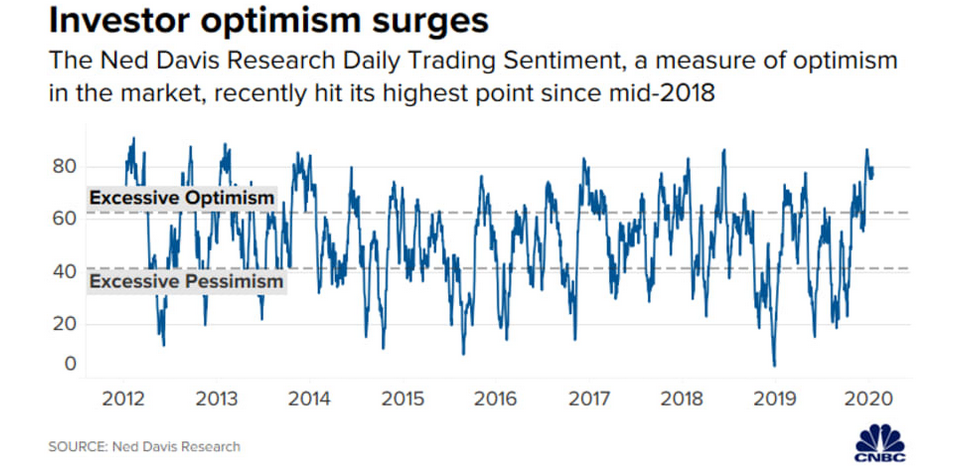
The Ned Davis Daily Trading Sentiment Composite, which measures levels of trader optimisim or pessimism, has hit 80, putting it at “excessive optimism” levels. While this doesn’t necessitate a correction, it will probably require strong earnings results to keep stocks at record levels. Particularly salient, the S&P 500 has fallen 5% on average since 2006 whenever the composite crossed 62.5 levels, much lower than where they are right now.
Strong Data Propels Dollar, But Investors Could Be Hedging Their Bets
Yields for long-dated Treasurys jumped after the U.S. Treasury announced the launch of new 20-year bonds alongside strong economic data. U.S. housing starts surged to a 13-year high. The Philadelphia Fed Manufacturing Index cranked out the highest numbers in eight months. New jobless claims declined for the fifth straight week. Not least, retail sales climbed 0.3% last month.
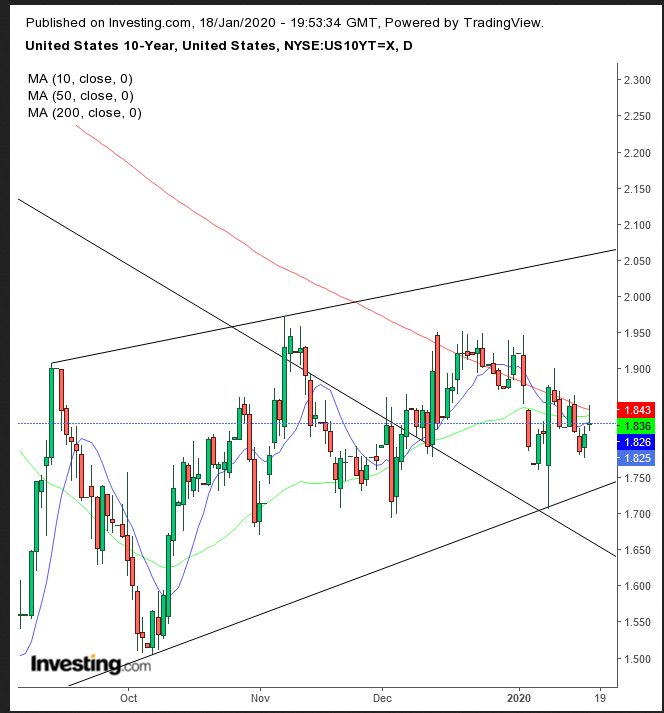
Still, amid all that optimism, 10- and 30-year yields couldn’t get passed the 200 DMA, which is still guarding the long-term downtrend.
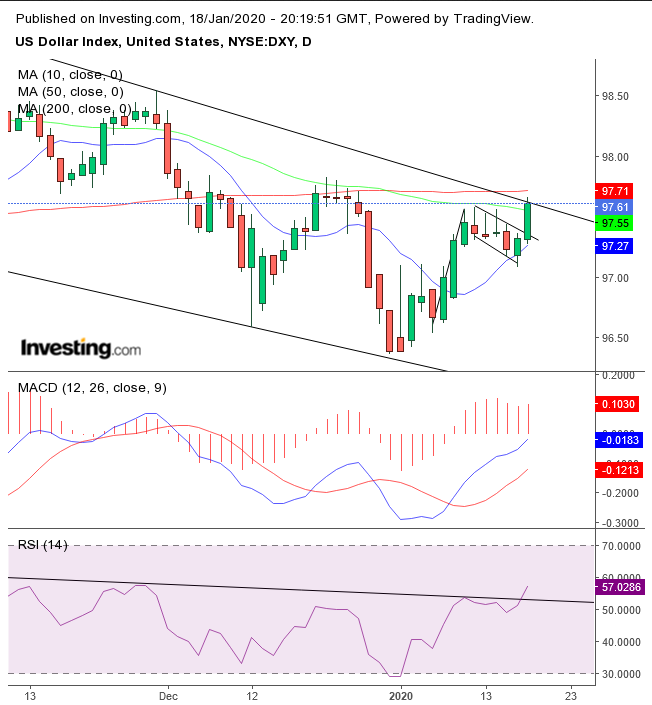
Positive U.S. data drove the dollar to its highest since Dec. 25. The global reserve currency stopped right below the top of a falling channel since the Oct. 1 top and the 200 DMA.
However, the USD may have broken to the topside of a falling flag, bullish after the 1% percent jump in the three consecutive gains from the low of Jan. 6 to the high of Jan. 9. Both the MACD and RSI are providing bullish signals, suggesting the dollar will cross over the 200 DMA and break out of its falling channel.
The Week Ahead
All times listed are EST
Monday
13:30: Eurozone – ECB President Lagarde Speaks
22:00: Japan – BoJ Outlook Report and Interest Rate Decision: no change expected to the current rate of -0.10%.
Tuesday
4:30: UK – Claimant Count Change: anticipated to have fallen to 24.5K in December from 28.8K in the previous month.
5:00: Eurozone – ZEW Economic Sentiment: predicted to drop to 5.5 from 11.2.
Wednesday
4:30: UK – Retail Sales: likely to surge to 2.6% from 1.0%.
10:00: U.S. – Existing Home Sales: probably rose to 5.43M from 5.35M.
10:00: Canada – BoC Interest Rate Decision: Forecast to remain unchanged at 1.75%.
Thursday
7:45: Eurozone – ECB Interest Rate Decision: seen to remain at 0.00%.
11:00: U.S. – Crude Oil Inventories: saw a drawdown last week of -2.549M barrels.
Friday
3:30: Germany – Manufacturing PMI: expected to edge higher to 44.6 from 43.7.
4:30: UK – Manufacturing PMI: likely to tick up to 47.6 from 47.5 in the previous month.
8:30: Canada – Core Retail Sales: anticipated to have jumped to 0.4% in November, from -0.5% in October.
