This past week wreaked havoc on the markets as oil, the US dollar, and the USD/JPY, all closed deep in the red while bonds and gold screamed higher. Governments and Central Banks around the world continued to provide stimulus to their economies. Wednesday was the sole bright spot, as stock markets had gone bid on the back of Joe Biden’s upset win on Super Tuesday, only to close near unchanged on the week. It’s now a 2-person race for the democratic candidacy, between Joe Biden and Bernie Sanders, to face President Trump for US President in November. More primaries are to come this week, along with the Bank of England’s Spring Budget 2020 Report, and a smattering of economic data. However, the coronavirus is still likely to remain the focus.
Here are the final numbers for the weeks: SPX: 0%, WTI: -9%, DXY: -2.15%, USD/JPY: -2.4%, US 10-year: +4%, Gold: +6%. That data, combined with last week’s route, has led to one of the largest 2-week moves in history. The coronavirus is wreaking havoc on the markets. Lack of demand had been causing a selloff in oil for weeks. At the OPEC meeting, members decided to cut an additional 1 million barrels per day (bpd). However, Russia (a non-member) said they would not cut back and OPEC decided that no deal is better than some deal, so they called it off. WTI is down over 10% Friday alone (after being up 1% on the week). USD/JPY and US bond yields have been tightly correlated this week, so its no surprise that as bonds went bid (yields lower) USD/JPY came off. Two weeks ago, USD/JPY was above 112.00. Now, price is trying to keep its head about 105.00. After everyone wondered last week if gold was broken, it finally turned a corner and went higher this week, up 6%.
As the coronavirus kicks into cruise control and spreads throughout the world, the economic uncertainty remains. Until traders know more about the virus (how many people will get it, how many people will die from it, will it mutate into more strains, etc.), risk should continue to come off. The US Federal Reserve, the Reserve Bank of Australia, and the Bank of Canada have already cut rates to help stem the potential fallout from an economic downturn. Next week, the European Central Bank meets. In 2 weeks, the Bank of Japan and the Bank of England meet. In addition, governments around the world have been providing extra stimulus to help firms which have been hit hardest by the virus. This week, the UK releases is 2020 Spring Budget. Expect a line item for the coronavirus.
The primaries continue next week, and it has come down to a 2-person race for the democratic candidacy. Joe Biden (652 delegates) pulled a stunning upset over Bernie Sanders (573 delegates) on Super Tuesday this week and is now considered the man to beat. On Tuesday, there will be a total of 6 more primaries and caucuses with 365 more delegates up for grabs.
Economic data for this week is as follows:
Monday
- Japan: GDP Growth Rate (Q4) Final
- Germany: Trade Balance (Jan)
- Germany: Industrial Production (Jan)
Tuesday
- Australia: NBA Business Confidence (Feb)
- China: Inflation Rate (Feb)
- EU: GDP Growth Rate (Q4) 3rd Estimate
- EU: Employment Change (Q4) Final
Wednesday
- New Zealand: Electronic Retail Card Spending (Feb)
- RBA: Debelle Speech
- Australia: Westpac Consumer Confidence Change (Feb)
- Australia: Home Loans (Jan)
- UK: Trade Balance (Jan)
- UK: Industrial Production (Jan)
- UK: GDP 3-Month Avg (Jan)
- UK: Manufacturing Production (Jan)
- UK: Spring Budget 2020
- US: Inflation Rate (Feb)
- Crude Inventories Data
Thursday
- Australia: Consumer Inflation Expectations (Mar)
- US: PPI (Feb)
- ECB Interest Rate Decision
Friday
- New Zealand: Business NZ PMI (Feb)
- Germany: Inflation Rate (Feb)
- US: Michigan Consumer Expectations Prel (Mar)
Chart to Watch: Weekly US 10-Year Yields

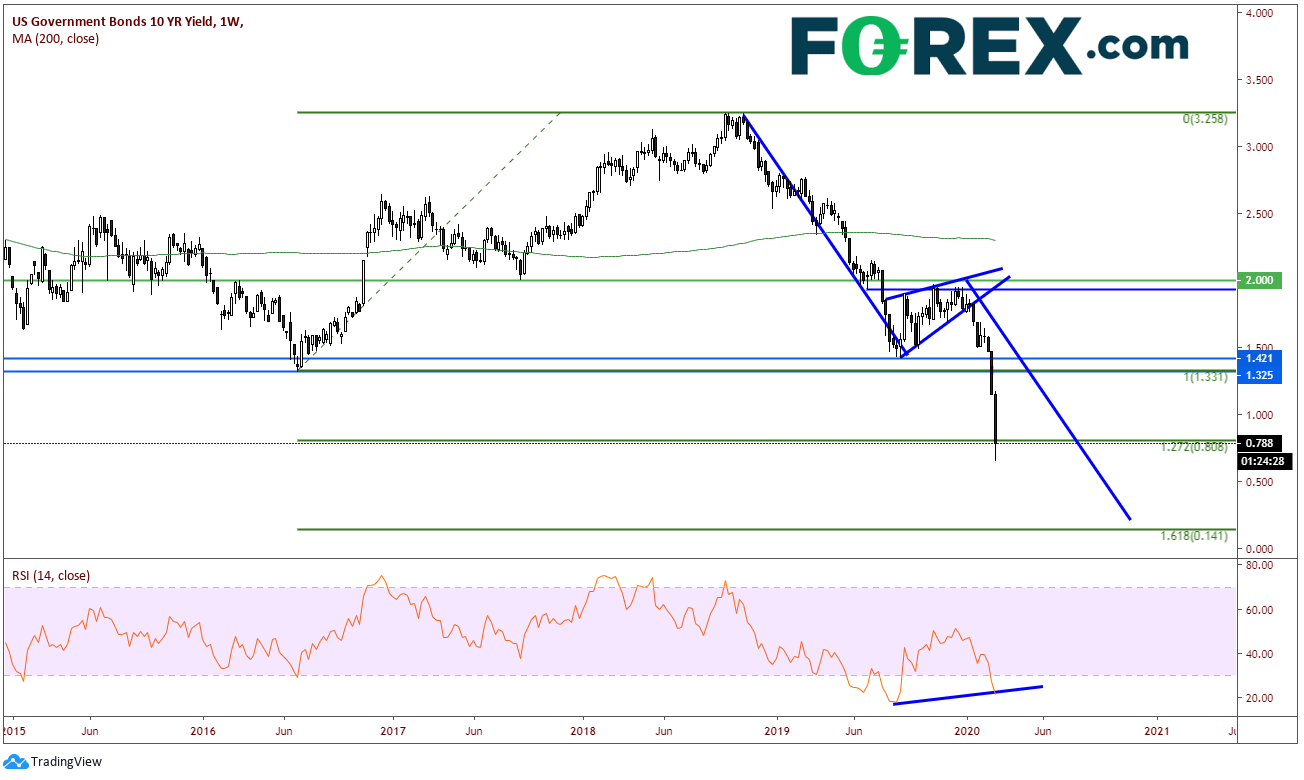
This chart is melting lower. As bond markets price in more US rate cuts at the March 18th meeting, yields are tumbling. Yields have closed the week at the 127.2% Fibonacci Extension level from the lows in July 2016 to the highs in November 2018, near 0.78%! Price closed at the lowest level for 10-Year Yields EVER! Just 2 weeks ago yields were near 1.5%. On the way down from the highs, yields stalled in the second half of 2019 between 1.5% and 2.0%, forming a pennant. The target for the breakdown of a pennant is the length of the pole, added to the breakdown level from the pennant. This level is near 0.20% and coincides near the 161.8% Fibonacci Extension from the previously mentioned timeframe near 0.14%. Yikes!! The RSI is diverging with price in oversold territory, so yields may get a short-term bounce.
Have a great weekend! Remember to wash your hands!
