- All four main U.S. indices top out in the medium-term
- Trump escalates trade wars, targeting Mexico as well as India
- VIX has its highest close since January
It looks like the first full monthly equity decline of the year, which occurred in May, could extend as June trading begins. U.S. major indices—the S&P 500, Dow Jones, NASDAQ Composite and Russell 2000—all plummeted on Friday after President Donald Trump threatened Mexico with incremental tariffs as he opened yet another potential front in his trade war. He also stripped India of its special trade status designation which had exempted the Asian nation from billions of dollars in U.S. tariffs on about 2,000 products.
Treasury yields slumped for a fourth straight day, to the lowest levels since September 2017, sealing a fourth consecutive weekly decline of 6.57%.
In addition, it appears that China has stepped up its retaliation for the U.S.'s blacklisting of Huawei, when the Xinhua news agency reported on Saturday that China was opening an investigation into whether FedEx (NYSE:FDX) "had damaged the legal rights and interests of its clients" after Huawei claimed the U.S.-based global delivery service diverted its parcels.
Worst Declines Since Christmas Eve Rout
Last Friday's U.S. stock market's weekly decline was the worst since the December 2018 Christmas Eve rout. From a technical perspective, all four major indices extended downside breakouts off tops, and each entered downtrends in the medium-term. If equities fall below the December bottom, it would likely end the long-term uptrend that's been in place since the 2009 bottom.
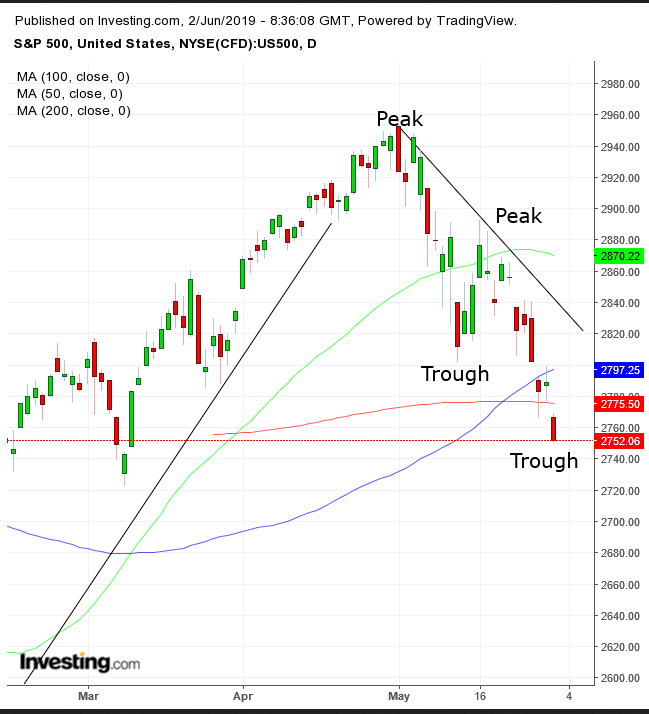
The S&P 500 fell 1.32% on Friday, with all sectors but Real Estate (+0.83%) and Utilities (+0.47%) in the red. Technology (-1.67%) and Communication Services (-1.55%) led the declines.
Half of the past week's 2.62% declines occurred on Friday; for the week, every single sector participated in the losses. Energy (-4.63%) underperformed, tracking oil’s worst week of the year. Technically, the price extended the penetration of a H&S neckline—as it registered the second trough to complete a descending series of peaks and troughs—to just shy of two percent, falling through a second gap, as it slipped below the 100 and 200 DMA, as if they weren’t there at all. The RSI fell to 30.84, the lowest since the slump in December.
On the weekly chart, the price extended a broadening pattern since January 2018, as it slumped through the 50 WMA. The index has posted higher highs and registered lower lows, since the start of 2018, forming a top. The weekly MACD’s shorter MA fell through the longer MA, producing a sell signal. As well, the RSI topped out, providing a second negative divergence, as it posted its third lower trough, challenging the three rising peaks of January 2018, September 2018 and April 2019.
The Dow dropped 1.41% on Friday, extending its weekly loss to 3.01%. The mega cap index also suffered two falling gaps, in which it completed a H&S top, after having fallen below the 100 and the 200 DMAs, as the 100 DMA crossed below the 200 DMA.
On the weekly chart, the Dow resumed a massive H&S formation, also in play since January 2018, as the price sliced through the 50 WMA. The MACD and the RSI provided similar patterns to those for the SPX. The Dow has tumbled for five straight weeks, longer than any of the other major U.S. indices. Ironically, however, it outperformed, selling off 'just' 6.4%.
The NASDAQ Composite underperformed on Friday, shedding 1.51% of value, bringing the weekly loss for the tech-heavy index to 2.41%. Like the S&P 500 and the Dow, the NASDAQ fell through the 100 and 200 DMAs, though without gaps, as it completed a H&S reversal, with all the same patterns and triggers on the weekly chart, as seen on the SPX. The NASDAQ fell for the fourth consecutive week, down 8.52%
On a daily basis, the Russell 2000 (-1.29%) outperformed on Friday, but only slightly. It continued to defy the trade narrative in which we’d expect domestically focused small caps would have a decisive advantage. The small cap benchmark underperformed during the 4-week selloff, losing 9.2% of value.
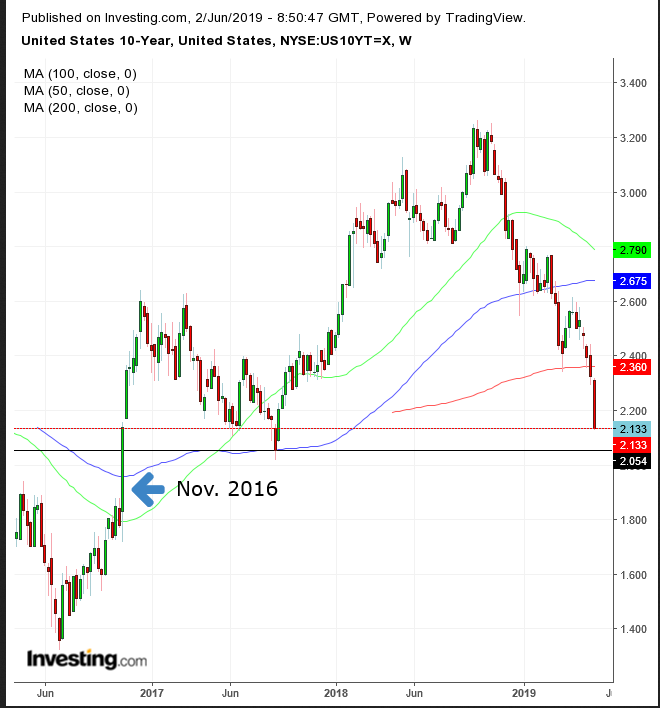
The yield on the U.S. 10-year Treasury note fell to 2.133, its biggest weekly descent since 2014, as traders fully priced in two rate cuts for the year amid angst over the threat of a recession. The rate fell to the lowest point since Sep. 10, 2017, just 10 basis points away from the Nov. 8, 2016 low, when the Donald Trump surprised by winning the U.S. election. Technically, the yield extended last week's fall, closing below its 200 WMA.
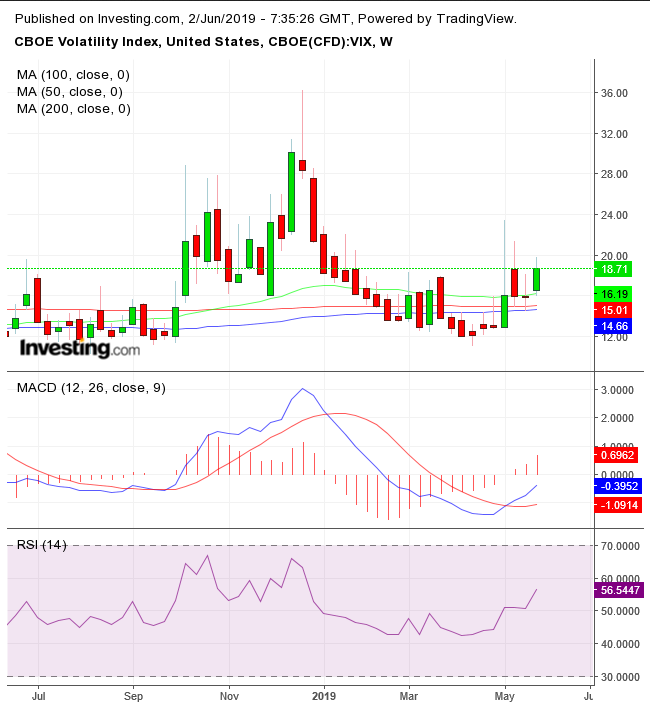
Trader bets on further volatility increased, driving the VIX to its highest weekly close since January. Both the MACD and RSI are projecting additional uncertainty.
Trade Tiffs Escalate
President Trump’s latest trade salvo, aimed at Mexico, calls for 5% duties to be levied by that country's imports beginning June 10. If Mexico doesn't stop "illegal migrants," the tariffs would rise incrementally to 25% in October. As Trump ratchets up his all-out trade-war against the world, China published an official document laying the blame for global trade problems squarely on Trump, after the administration blamed China for back-pedaling out of negotiated agreements.
Perhaps the U.S. president feels it’s now or never to reverse what he views as the U.S.'s position of getting the short end of the trade stick—and deliver big on his campaign promises. The U.S. economy is currently healthy enough, as spending and income beat expectations and the Fed’s preferred measure, core PCE—which calculates spending minus volatile food and energy costs—climbed 0.2% from the prior month and 1.6% from a year earlier following a downward 1.5% revision in March.
From a market perspective, it's certainly in Trump’s interest to get a bear market out of the way, so that come the 2020 election, equities will already have bottomed and as the U.S. heads to the polls will be on the rise. Since 1928 there have been 23 elections. In almost all cases, in the three-month period beforehand, when the market was going up the incumbent or his party won.
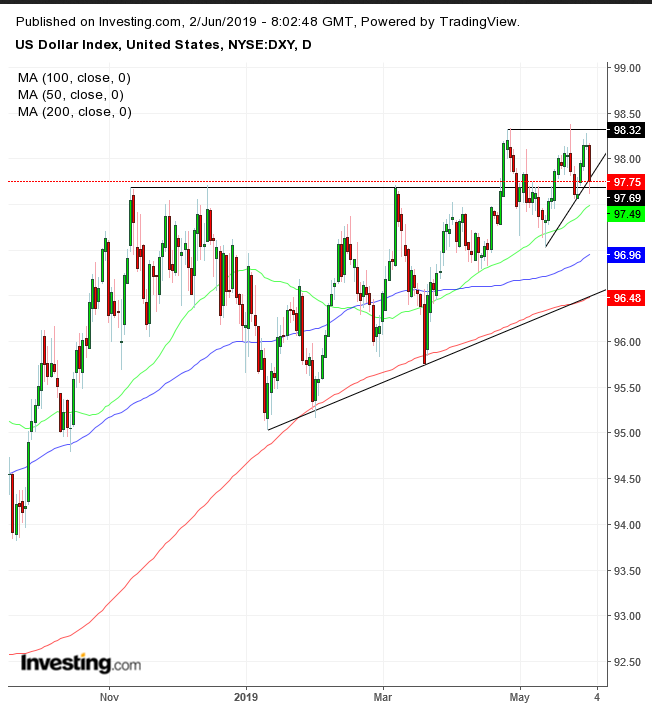
The U.S. dollar also fell on Friday, losing 0.41%. It penetrated the upper boundary of both the large ascending triangle since November, as well as the small ascending triangle since April, found support and closed back above the large triangle and on the bottom of the small triangle. That makes the current position an ideal long entry from a risk-reward perspective.
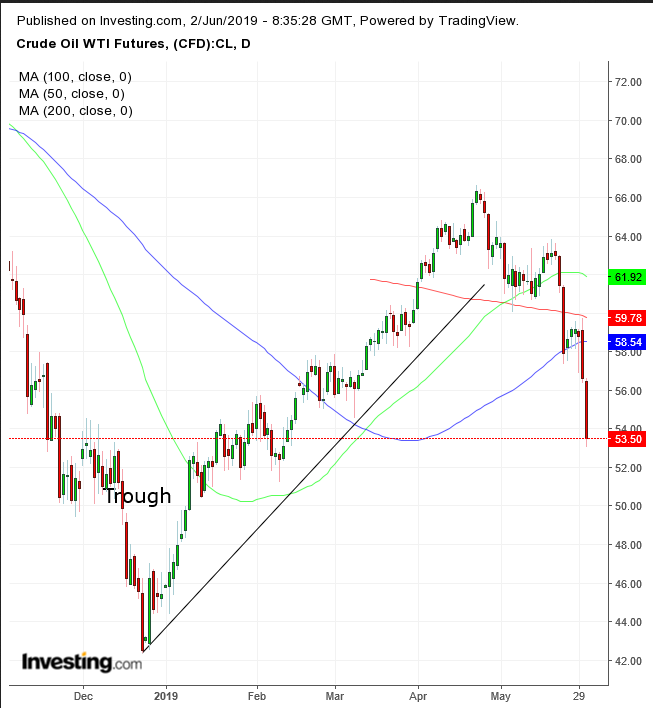
Oil plunged on Friday, dropping 5.46% as countries fell into line behind the U.S. demand to stop buying Iranian oil. Japan’s Iran imports dropped 42% MoM to 169,100 barrels per day in April. The escalating trade wars and implications for slowing growth further tamped down demand. Technically, the oil market extended its reversal into a downtrend in the medium-term.
Week Ahead
All times listed are EDT
Sunday
21:45: China – Caixin Manufacturing PMI: expected to edge down to 50.0, the red line separating and expansion and contraction, from 50.02 previous.
Monday
3:55: Germany – Manufacturing PMI: forecast to remain flat at 44.3.
4:30: U.K. – Manufacturing PMI: seen to drop to 52.5 from 53.1 a month earlier.
10:00: U.S. – ISM Manufacturing PMI: likely to have edged up to 53.0 in May from 52.8 previously.
21:30: Australia – Retail Sales: consensus has this metric falling to 0.2% from 0.3% MoM.
Tuesday
00:30: Australia – RBA Interest Rate Decision: expected to be cut to 1.25% from 1.50%.
00:30: Australia – RBA Rate Statement
4:30: U.K. – Construction PMI: expected to have remained flat at 50.5.
5:00: Eurozone – CPI: seen to have slumped to 1.3% YoY from 1.7%.
9:45: U.S. – Fed Chair Powell Speaks
Tentative: U.K. – Parliament Vote on Brexit Deal: Will the fourth time be the charm? (We're not betting on it.)
21:30: Australia – GDP: expected to rise to 0.4% QoQ.
Wednesday
4:30: U.K. – Services PMI: expected to climb to 50.6 from 50.4.
8:15: U.S. – ADP Nonfarm Employment Change: predicted to fall to 185K from 275K previous.
Thursday
5:00: U.K. – BoE Gov Carney Speaks
7:45: Eurozone – Deposit Facility Rate: seen to remain at -0.40%.
7:45: Eurozone – ECB Marginal Lending Facility: expected to remain at 0.25%.
7:45: Eurozone – Interest Rate Decision: likely to stay at 0.00%.
10:00: Canada – Ivey PMI: expected to rise to 56.2 from 55.9.
Friday
8:30: U.S. – Nonfarm Payrolls: forecast to be 183K, from 263K last month.
8:30: U.S. – Unemployment Rate: seen to be unchanged at 3.6%.
8:30: Canada – Employment Change: expected to have dropped to 7.5K from 106.5K in the previous month.
