- All U.S. indices on the brink of H&S tops or in the case of the Russell, a double-top
- U.S. economy set to see longest expansion on record, but on tepid growth
- Market structure continues to be mis-aligned with market narrative
- U.S. Memorial Day Holiday
- U.K. Spring Bank Holiday
Though all four major U.S. indices eked out gains on Friday, on thin trade ahead of the Memorial Day weekend, it wasn't enough to recoup losses incurred over the course of the week. Daily vacillations driven by wavering sentiment on the possibility of a trade war settlement ultimately pushed the S&P 500, Dow Jones, NASDAQ and Russell 2000 to yet another series of weekly declines as well as to the brink of an official downtrend in the medium-term.
The run on Treasurys came to a halt on Friday, the U.S. dollar slipped for a second day, as well as for the week. The pound sterling rebounded after Prime Minister Theresa May announced she would be resigning from office.

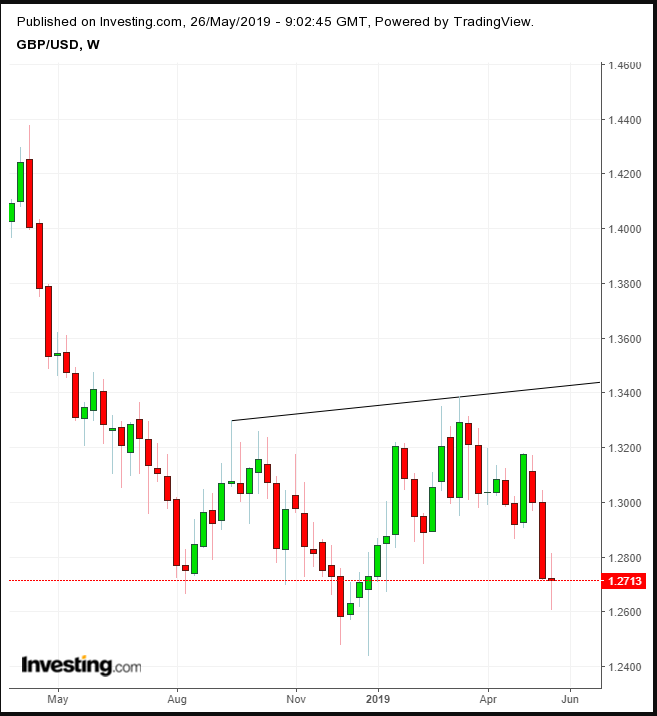
Technically, the pound continues to trade along a massive H&S bottom, finding support this past week by the Aug. 18 lows, which made up the left shoulder of the major reversal pattern.
Oil stabilized.
Trade War Taking Toll On Global, U.S. Economies
Thursday’s disappointing American factory data confirmed for many the unavoidable impact of an escalating trade war to the U.S. economy, not just the global consequences, as was recently projected through falling confidence among German businesses. Market structure continues to break down, as small caps perform poorly even as the dollar grows stronger— which shouldn't be the case. A ramp-up of the current trade war ought to have the opposite impact on domestic-focused small caps not to mention the global reserve currency.
On the final day of this past week's trade, the S&P squeezed out a 0.14% advance. Eight of the benchmark’s eleven sectors finished in the green. Financials (+0.79%) outperformed while Consumer Staples (-0.36%) lagged.
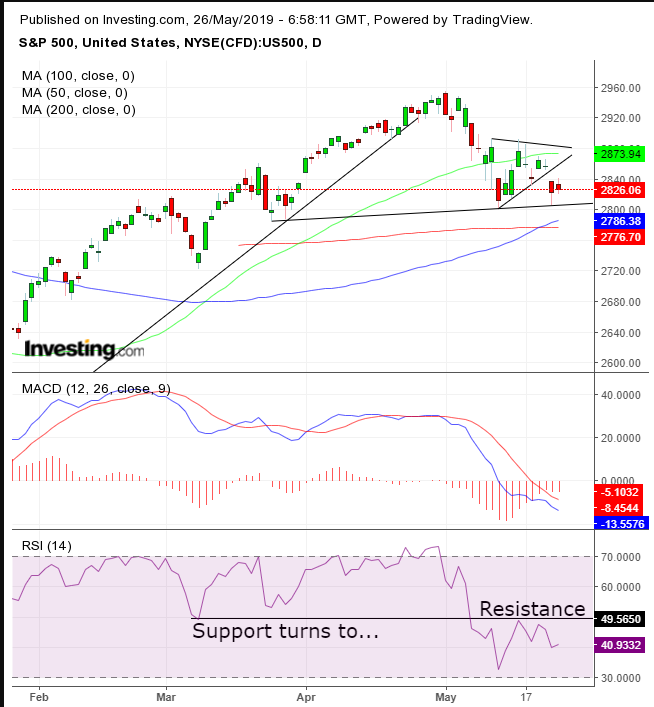
For the week, the SPX slumped, down 1.17%, with eight sectors in red. Energy plunged 3.34%, as expanding inventories compounded the negative outlook for demand amid a global trade war. This was the index's third consecutive drop. Technically, a fall below the 2,800 level would signal the start of a medium-term downtrend.
We have been bearish on the market's medium-term outlook since early December. And despite a still booming economy that in June will earn a record for the longest positive GDP recorded, surpassing the robust expansion of the 1990s, there’s still a snag.
The U.S. just reached a record 13 straight years without real GDP growth reaching 3%. Unemployment—at 3.6%—is at a 50-year low. Nonetheless, one has to ask, is this sustainable given technology’s exponential growth which will likely put more and more humans out of work?
On the other hand, this is still the second most profitable bull market, with a more than 400% return from the 2009 lows. However, does that make this an appropriate time to enter the market…or exit it?

The S&P 500 found support above the 2,800 level, which hasn’t been broken since March. The 200 DMA has flattened right below this level.
However, it provided a downside breakout for a pennant since the beginning of the month, bearish after the fall, as is reflected in the beginning of the 200 DMA’s downward curve, even after the 100 DMA crossed above it, lagging the rally, which fell below its uptrend line in late April. A fall below the 200 DMA would complete a H&S top, registering a descending series of peaks and troughs, establishing a medium-term downtrend.
The completed pennant suggests the H&S reversal would itself finish with a downside breakout of the neckline, the trend line connecting the two previous lows, from late March to mid-May. Also, the RSI provided a negative divergence when it fell below not only its level of the price lows—making up the neckline—but even below its Mar. 8 level.
In fact, the RSI fell to its lowest point since the beginning of the year, when the price was at the 2,400 level. Since momentum leads price, the weakness in momentum adds to the weight of the evidence that prices will fall as well.
The Dow Jones Industrial Average recouped 0.37% on Friday, but dropped 0.69% for the week, for a fifth straight week. This is its longest decline since 2011, for a total decline of 3.67%. Technically, the price pared losses after successfully testing the 200 DMA on Thursday. A fall below the 2,5208, Mar. 11 low would complete a H&S top.
The NASDAQ gained just 0.11% on Friday, making it the laggard among major U.S. indices, as U.S. tech companies wait for Chinese retaliation after the U.S.'s Huawei ban. The tech-heavy index slipped 2.29% for the week, underperforming on that measure as well. This was the benchmark’s third consecutive weekly decline; it's now off by 6.46%.
The interim positive outlook on a trade deal saved it from being the worst performing benchmark during the overall selloff. From a technical perspective, the index closed right on top of the neckline of a H&S top. The 200 DMA is just 1.5% below, at 7,530.
The small cap Russell 2000 was the outperformer yet again on Friday, jumping 1.03%. However, it didn’t fare as well for the entire week. It dropped 1.41% during the period, for the third straight week of losses, down 6.19%.
It was the second worst performer, just behind the NASDAQ, adding to a long string of market narrative and structural inconsistencies. We pointed out repeatedly over the past months that the trade narrative isn’t aligned with internal market structure. If it were, large caps and tech stocks would fall, while small caps would rise, when a trade deal appears to be slipping away.
Since the current selloff has been directly attributed to this market theme, the performance of small caps should be out of the park, given their distance from tariff sensitivity or any disruption of global shipping. Additionally, the muscular dollar should provide a boost small caps, which are unaffected by unfavorable exchange rates for U.S. exporters.

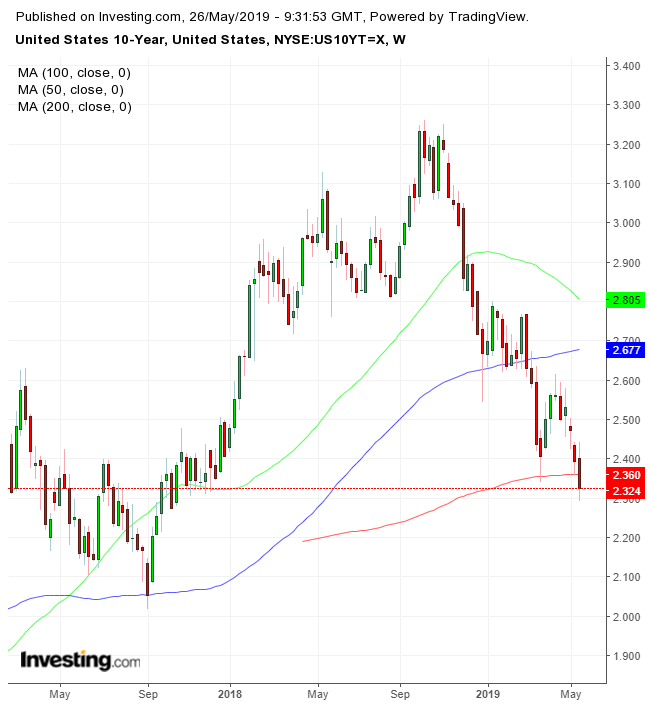
The yield on 10-year Treasurys fell to the lowest point since October 2017, closing below the 200 WMA. This is not a sign of investor faith in economic growth.
The Week Ahead
All times listed are EDT
Monday
Tuesday
10:00: U.S. – Consumer Confidence: expected to edge up to 130.0 from 129.2.
Wednesday
3:55: Germany – Unemployment Change and Unemployment Rate: unemployment change seen to jump to -8K from -12K MoM, while the unemployment rate remains flat at 4.9%.
10:00: Canada – BoC Interest Rate Decision followed by BoC Rate Statement: Analysts predict the bank will no longer hike rates before the end of 2020, while 40% of those surveyed price in a cut. The USD/CAD has been trendless since April.
Thursday
8:30: U.S. – GDP: probably slipped to 3.1% from 3.2% QoQ. The economy tends to lag behind the stock market, which is considered a leading indicator to economic growth.
10:00: U.S. – Pending Home Sales: expected to have dropped to 0.9% MoM from 3.8% previously.
11:00: U.S. – Crude Oil Inventories: WTI advanced Friday as supply risks outweighed the uncertainties of the trade dispute.

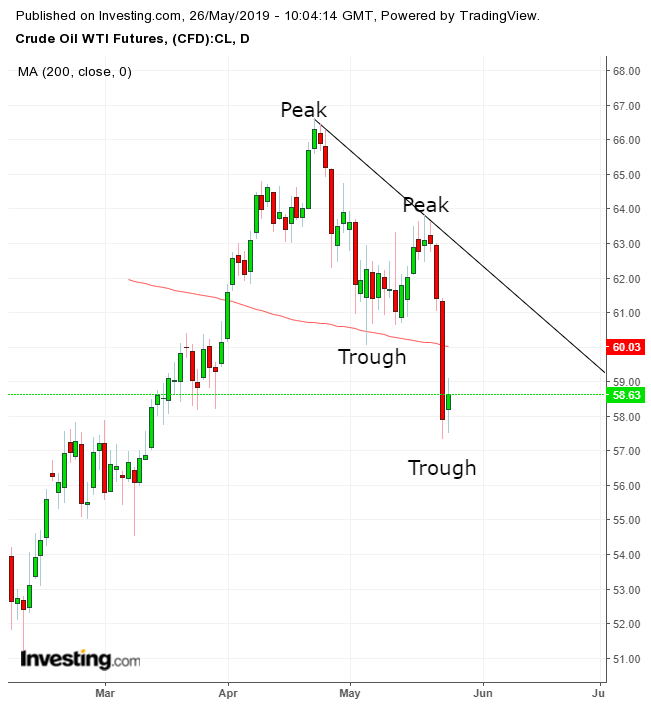
However, the price of oil slumped 6.58% during the past week, its worst performance since mid-December. Technically, the commodity entered a medium-term downtrend.
21:00: China – Manufacturing PMI: seen to have edged down, into the contraction zone, to 49.9 from 50.1, as both the U.S. and China hold on for a rough ride, in which China isn’t expected to descend into submission, while it’s unclear whether the U.S. president will back off his trade attacks.
Friday
8:30: Canada – GDP: likely to have climbed to 0.2% from -0.1%.
