- Lack of market participation, and outlook for falling yields could hurt equities
- Stronger dollar would hurt U.S. exports amid a global trade war
- BoC and BoJ both release interest Rate Decisions
After U.S. stocks finished mixed during a holiday-shortened week, investors are now wondering, with equities having reached what may be considered normalized valuations, will corporate earnings and economic data be able to push stocks to new all-time highs? Without a crystal ball we couldn't possibly say, but with about two-thirds of the companies listed on the S&P 500 set to report first-quarter results over the next few weeks, traders will have plenty of fodder to determine where markets might be headed next.
For our part, we remain cautious on the post-Christmas rally. Here is our case:
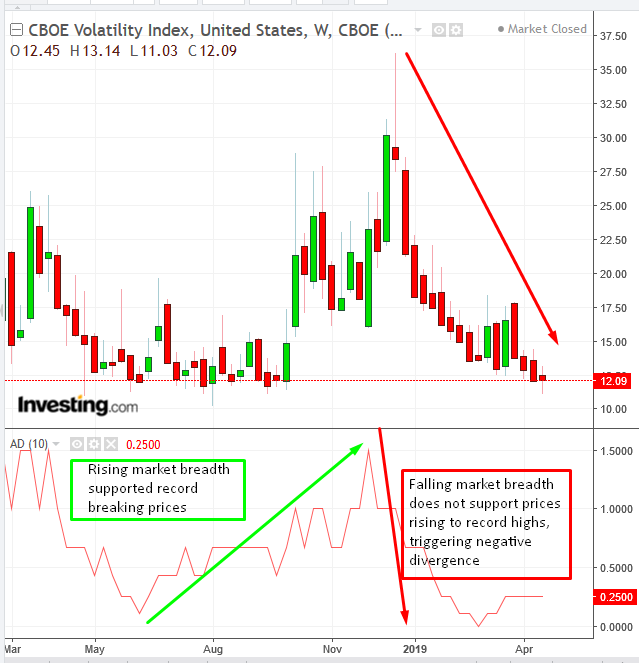
Chart powered by TradingView
As the CBOE Volatility Index (VIX) reached its lowest levels since U.S. equities posted all-time highs, the lack of volatility could be comforting enough for traders to push prices past records. On the other hand, subdued volume and lack of market breadth are red flags that could be signaling investors have adopted a false sense of security, making them complacent right before they get slammed.
Since early December—ahead of the Christmas Eve rout—we've made no secret of our bearishness toward the S&P 500, when it posted a second trough, completing a descending series of peaks and troughs in a downtrend formation. We did warn, however, that a stricter interpretation would not include the September peak, which was still part of the prior uptrend, as the first peak within the downtrend. In this case, that more demanding standard may be vindicated, should prices scale above record highs.
As well, even as prices were falling ahead of the post-Christmas rebound, we predicted another rally. We stipulated, though, that it would likely find resistance at the 2800 levels, which it did, for 8 whole weeks, and conceded that prices rising over 2,900 would force us to take another, hard look at our trajectory.
Last week the benchmark index reached a high of 2,918 and closed at 2,9005, just 5 points above our red line. Is this enough for us to turn bullish? Starkly negative divergence with breadth and volume tell us we should stick to our guns while we wait and see if there is enough oomph left in the market to take on record highs.
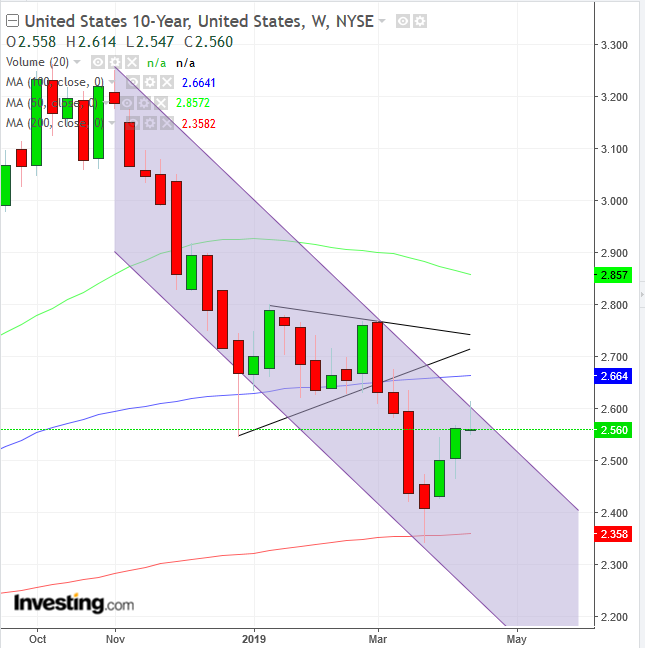
Chart powered by TradingView
The bond market is sending up another red flag. Investors have been steadily increasing their Treasury holdings, placing yields in a well-defined downtrend, even as equities hit record highs, as the exuberant post-Christmas rebound, among other gains, sent the Dow higher by 1000 points in a single day, the mega cap index's biggest daily jump in nearly a decade.
Last week’s trade in the benchmark 10-year Treasury note formed an ominous-looking shooting star, with an extremely long upper shadow. It successfully tested the upper boundary of a descending channel since November, guarded by the 100 WMA, after a symmetrical triangle suggested the decline in yields isn't over yet. The trajectory for yields will be to retest the 200 WMA, after it acts as support for the lower boundary of the channel. Should this play out, that would suggest a decline for equities is upcoming.
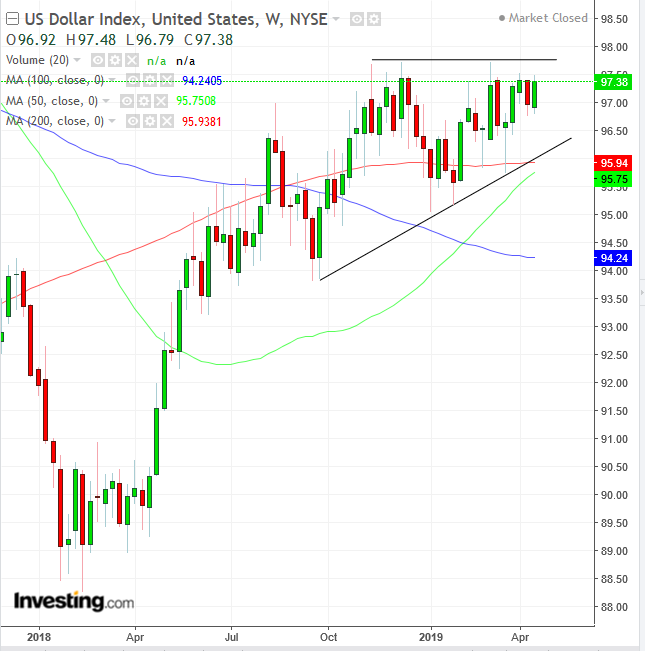
Chart powered by TradingView
Last week, the dollar jumped to its highest level since December, hitting the top of an ascending channel. An upside breakout would demonstrate that demand is gaining on supply, going out of its comfort zone to find more willing sellers.
After the 50 WMA crossed above the 100 WMA, it began gaining on the 200 WMA. This would trigger a rare golden cross on the weekly chart, something that hasn't happened since 2012.
An outlook for a higher dollar dovetails with rising demand for Treasurys, currently the most trusted, liquid asset on the planet, of which more than 40% are purchased by foreign investors who must buy the USD with every transaction. A stronger dollar would also weigh on U.S. exports, especially during the highly volatile global trade situation that's been dramatically set up by President Donald Trump after he recently threatened Europe with more tariffs.
A stronger dollar also supports a more bearish outlook for equities.
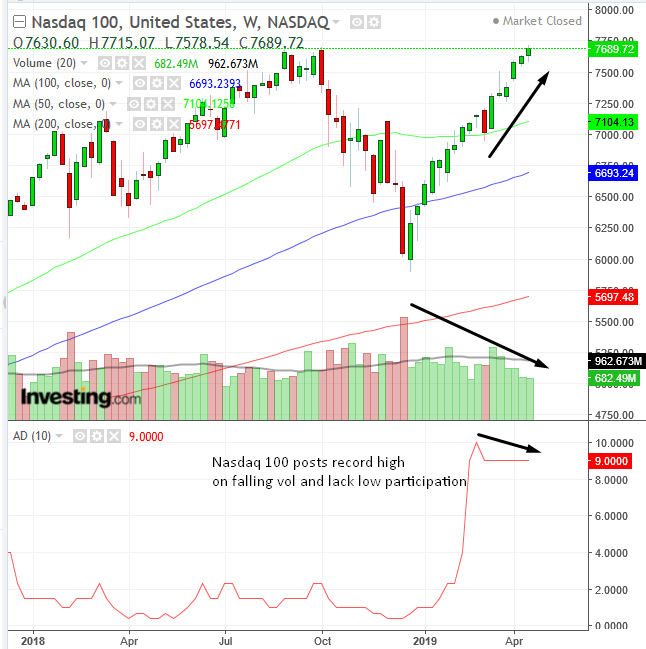
Chart powered by TradingView
Having said all that, if the broader market posts a new record-peak—something the NASDAQ 100 has already done—we’d have to do some serious revision as to our sentiment on the market.
The Week Ahead
All times listed are EDT
Monday
10:00: U.S. – Existing Home Sales: expected to fall to 5.31 million from 5.51 million.
Tuesday
10:00: U.S. – New Home Sales: also expected to decline to 647,000 from 667,000.
21:30: Australia – CPI: seen to fall to 0.2% from 0.5% QoQ and to drop to 1.5% from 1.8% YoY
Wednesday
10:00: Canada – BOC Interest Rate Decision; BoC Monetary Policy Report and Rate Statement (followed by a BOC Press Conference at 11:15)
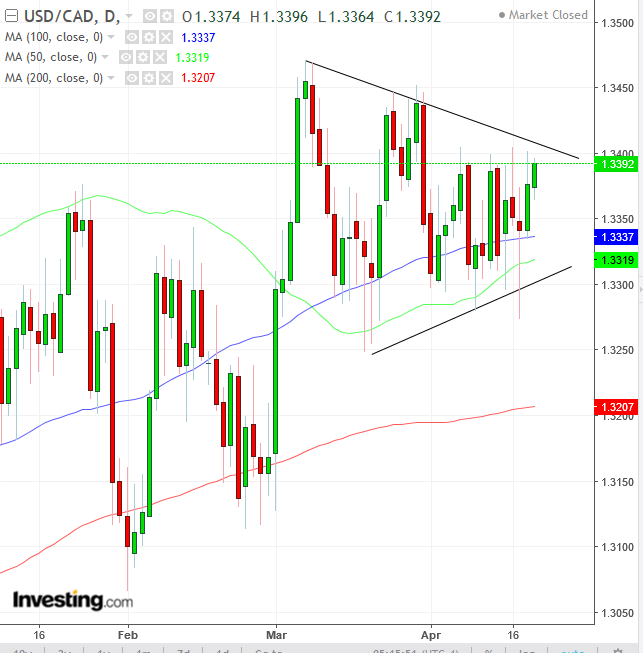
Chart powered by TradingView
The USD/CAD pair has been rising toward the top of a symmetrical triangle. The dynamics of the pattern is indecision. However, following an uptrend, there is a bias for an upside breakout, which itself would trigger a domino effect for another rally.
10:30: U.S. – Crude Oil Inventories: Last week stocks fell by 1.396M bb
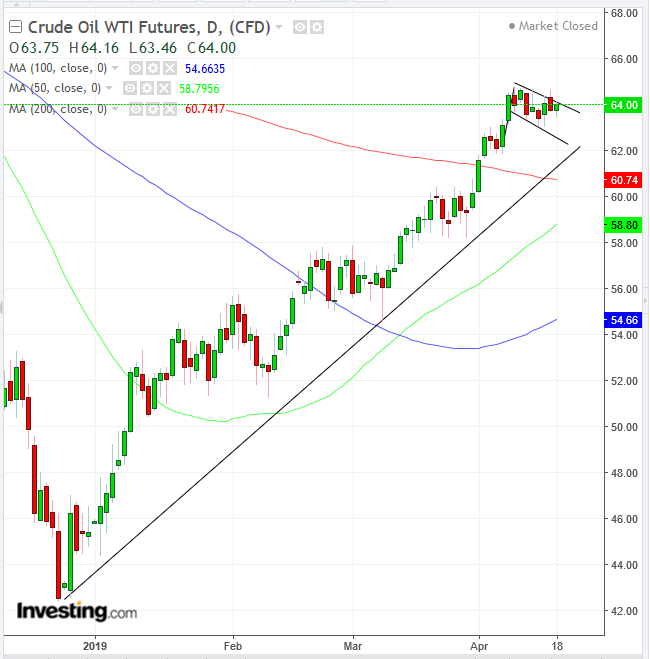
Oil's trading balance has been developing a falling flag, bullish in the uptrend since the beginning of the year. As well, the 50 DMA approaches the 200 DMA for a golden cross.
Tentative: Japan – BoJ Monetary Policy Statement, Outlook Report and Interest Rate Decision. The USD/JPY has been stuck been stuck below 112.00 since Feb. 28., with an upside breakout suggesting a retest of the 115.00 October highs, when equities were at record levels.
Thursday
8:30: U.S. – Core Durable Goods Orders: seen to jump to 0.2% from -0.1%
Friday
8:30: U.S. – GDP: expected to remain flat QoQ at 2.2%.
