- Tariff deadline extended, Kudlow promises historic agreement but stocks muted
- Small caps continue to outperform large caps
- Economic reports signal global slowing
- It could be that the market narrative about the trade war is off mark: either traders don't believe a meaningful resolution will be reached, or it may never have been an actual headwind in the first place. Or something else is going on, which is not yet fully known.
- Or, investors are all over the place, having lost sight of market leadership.
Shares of technology firms jumped on Friday after positive news from Amazon (NASDAQ:AMZN) and promises of new products from Apple (NASDAQ:AAPL) made headlines. The news also built on the White House's announcement confirming that the March 1 tariff deadline for Chinese goods would be extended.
All four major U.S. indices—the S&P 500, Dow Jones Industrials, NASDAQ Composite and Russell 2000—gained, turning the week into a winner for two of the four main benchmarks. Yields broke upside of congestion, pulling the dollar higher as well.
Still, all things considered, market reaction was muted, particularly to U.S. President Donald Trump’s cessation of trade war hostilities. Making this yet more surprising, White House economic advisor Larry Kudlow had said earlier that the world's two largest economies were on the brink of an historic agreement. Based on that, one would have assumed markets would soar.
Though the expectation of a delayed deadline was likely already priced in, we reckon investors might be growing weary of big promises, especially when they have thus far been followed by conflicting reports on actual progress.
NASDAQ Outperforms; Small Caps Add To Gains
The NASDAQ's Friday surge, +0.83%, made it the outperformer among major U.S. benchmarks. Amazon's announcement that it would open new brick-and-mortar grocery stores under a new, as-yet-to-be-named supermarket brand, and remarks by Apple CEO Tim Cook at the company's annual general meeting, that the iPhone maker is working on new products to “blow you away,” triggered the jump.
The tech-heavy index climbed 0.77% for the week, marking the 10th straight weekly gain for the index which is now up 20.05% since the December bottom. This magic number also puts it back in bull market territory, the longest since 1999, before the infamous tech-bubble crash in 2000. Technically, both Friday's daily candle, as well as the weekly candle, formed hanging men, bearish with confirmation of the following close below their real bodies, respectively.
The Russell 2000 was the second-best performer, +0.71%. Why is the small cap index continuing to outdo large and mega cap indices if trade talks have come this far? As we've pointed out before, since the trade dispute began, the pattern for the Russell has been clear, albeit puzzling.
When the trade war was at its height, investors stashed their capital in small caps, since domestic firms, which don't need international trade to thrive, would not be affected by tariffs. One would have therefore expected that when the saber-rattling cooled, investors would backpedal into larger cap shares. But this seemingly rational pattern hasn't occurred. We don't have a specific reason to point to, but a variety of options appears to be at play:
Of course, something else entirely could be at play, thought it's not yet known. Whatever the actual reason, the uncertainty isn't comforting. On the week, the Russell snapped a nine-week run, its longest in sixteen months, with a 0.03% setback.
The other primary benchmark to end a nine-week winning streak was the Dow. The mega-cap index underperformed on Friday, climbing just 0.43%. It slipped for the week, giving up 0.02%. Had investors been able to muster another 0.03%, the 30-component index would have matched its longest streak of weekly gains since 1995.

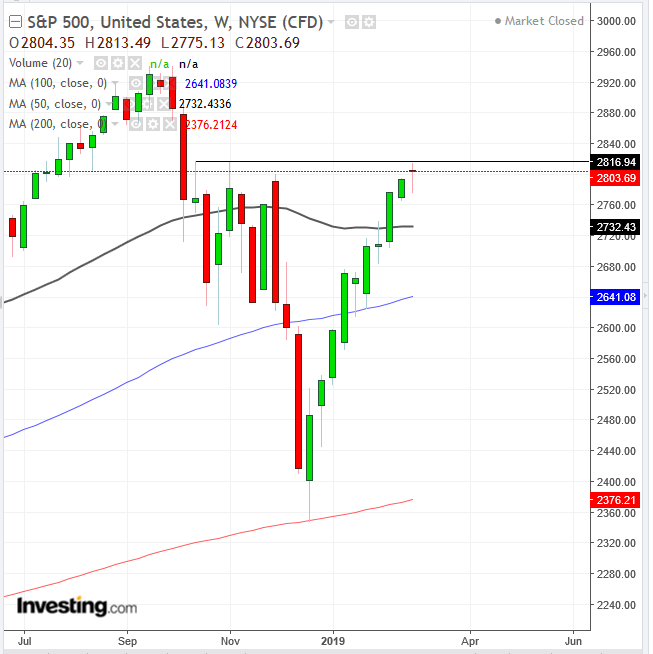
The S&P 500 gained 0.69% on Friday, breaking the 2,800 key-level and closing above it for the first time in 16 weeks. The index came back from its longest losing streak this year.
The Energy sector, up +1.84% on Friday, jumped to within 0.21 percent of its Feb. 20 close, the highest since Dec. 3—even though oil prices fell on Friday to their lowest level in three days. Consumer Staples (-0.18%), trade-sensitive Materials (-0.13) and Real Estate (-0.12%) were the only sectors in the red.
The popular benchmark notched a 0.39% gain on the week. Trade-sensitive Materials (-1.43%) lagged, offsetting Energy (+1.05%) gains. Technically, the Friday's candle formed a hanging man at the resistance of the previous high, Feb. 25. The weekly candle formed a high-wave candled, denoting lack of direction, typically formed at a rally-top.

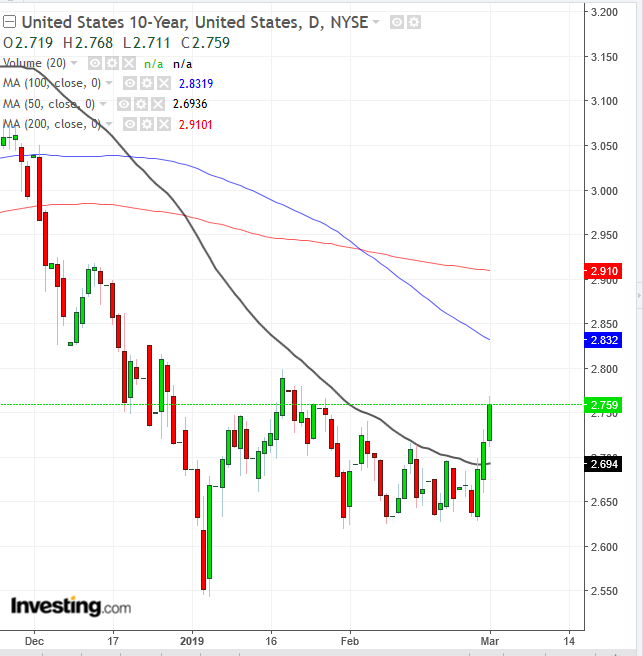
Meanwhile, 10-year Treasury yields broke to the topside of a bearish formation, crossing above the 50-day moving average with the next test being the Jan. 18 high.

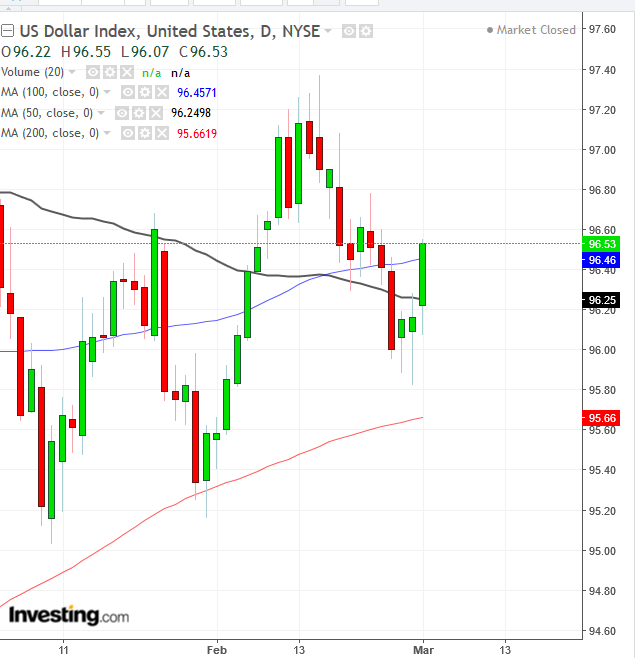
Higher yields tend to attract foreign demand for Treasuries, pushing the dollar higher as well. We're watching to see if it will post a third peak above the Feb. 15 high, within the short-term, after having already bounced above the 200 DMA three times.
Slowing Economy Weighing On Investors
Though equity benchmarks continue their upward trajectory, momentum does appear to be waning. We believe what's really weighing on investors is the economy, stupid.
Global manufacturing seems unable to rebound from negative territory. China, Japan and the euro area all showed signs of recent slowing. Even the U.S. didn't escape the downturn unscathed. The U.S. economy grew 2.6% in the final quarter of last year, slowing from the 2.9% pace for all of 2018. As well, the outlook for Q1 2019 is around 1.5%, nearly half that of last year.
But if the trade war were to be resolved, wouldn't manufacturing pick up as a result? If so, again we ask, why are investors so lukewarm?
Moreover, the other significant market headwind—in our opinion, the only real market tempest with lasting implications—was risk of rising interest rates. That's decreased. In addition the current market narrative says the Fed has adjusted its policy, tilting dovish as described by Fed Chair Jerome Powell when he used the term 'patient' to describe the central bank's new position.
If both of these possible headwinds are no longer relevant, what's holding investors back? Perhaps, as with trade, investors want to see a signed "agreement" from the Fed before they buy into any rhetoric.
Or maybe it’s all of the above, as well as the smart money not buying into the monetary policy adjustment, despite the market narrative. During his testimony last week, Powell told the Senate Banking Committee:
“When I say that we are going to be patient what that really means is that we are in no rush to make a judgment about changes in policy… We are going to be patient. We are going to allow the situation to evolve ... and allow the data to come in.”
This is what we have been arguing since his January address.
Upcoming speeches by Powell, New York Fed President John Williams, Boston Fed President Eric Rosengren and Cleveland Fed President Loretta Mester among others, could shed some light on what the Fed’s patience actually means. Will they convince markets the central bank has already adjusted its policy, or will the Fed remain cagey and ambiguous till new data is available so as not to panic markets?
The Week Ahead
All times listed are EST
Monday
4:30: UK – Construction PMI (February): forecast to edge down to 50.3 from 50.6.
20:45: China – Caixin Services PMI (February): expected to climb to 53.8 from 53.6.
Tuesday
4:30: UK – Services PMI (February): activity expected to weaken, falling to 49.9 from 50.1.
10:00: U.S. – New Home Sales (December), ISM Non-Manufacturing PMI (February): sales to fall to 590K from 657K MoM, while the ISM is expected to strengthen to 57.2 from 56.7.
19:30: Australia – GDP (Q4): expected to be 0.4% from 0.3% QoQ and 2.6% YoY from 2.8%
Wednesday
8:15: U.S. – ADP Payroll Report (February): forecast to see 190K jobs created, from 213K last month.
8:30: U.S. – Trade Balance (December): deficit expected to widen to $57.30 billion from a negative $49.30 billion.
10:00: Canada – Ivey PMI (February) and BoC Rate Decision: previous PMI reading 54.7; no change in central bank policy expected.
10:30: U.S. – EIA inventories (w/e 1 March): stockpiles to jump to 2.842 million from a negative 8.647 million barrels.
Thursday
5:00: Eurozone – Employment Change and GDP (Q4): employment to remain at 0.3% QoQ and at 1.2% YoY; GDP to remain at 0.2% QoQ and 1.2% YoY.
7:45: ECB – Rate Decision (8:30 Press Conference): Policy is expected to remain at 0.00%, but attention will focus on whether the bank has yet had any discussion surrounding further easing in the eurozone.
22:00 (tentative): China – Trade Balance (February): surplus to narrow to $25.55B billion from $39.16 billion. While this isn’t good for China’s growth in the short-term, it might be better for its long-term growth, as a widening surplus may have provoked President Donald Trump into scathing tweets, which may have risked a trade resolution.
Friday
8:30: U.S. – Nonfarm Payrolls (February): 180K jobs expected to have been created, from 304K a month earlier. Meanwhile, the unemployment rate is expected to keep falling to 3.9% from 4%, while average hourly earnings rise 0.3% MoM from 0.1%, both of which would apply pressure to the Fed to return to their hawkish posture.
