- If equities are climbing on trade hopes, why are small caps continuing to outperform?
- Yields lower than when 2019 equity rally began
- Yuan jumps on currency agreement pressures USD, boosting emerging markets
- Oil jumps, nearing $60 levels
- New Brexit vote expected in UK Parliament
U.S. shares jumped Friday after President Donald Trump said he'll extend China's March 1 tariff deadline if he sees progress in the U.S.-Sino trade negotiations. Seemingly in response to the president's offer (or was it an ultimatum?) to show some positive movement, the Chinese delegation announced it would remain in Washington over the weekend to continue the talks. In response, the Dow, S&P 500, NASDAQ Composite extended their rallies with the small cap Russell 2000 outperforming peer indices.
While equity markets obviously consider trade progress a catalyst for growth, we've been pointing out for some time now that market signals might be telling something of a different story. Small caps, which should be collapsing on trade progress since they're primarily domestic-focused stocks and thus not exposed to global markets, continue to outperform across the board. That of course raises the question: if, in fact, trade is the headwind so many claim, why aren't mega caps, and the indices on which they're represented, outperforming?
As well, Treasuries have been rising, depressing yields, suggesting investors are still holding on to the security of U.S. sovereign bonds and not going all-in equities. Indeed, we believe yields may drop lower still.
All Major Indices Gain But Small Caps Outperform
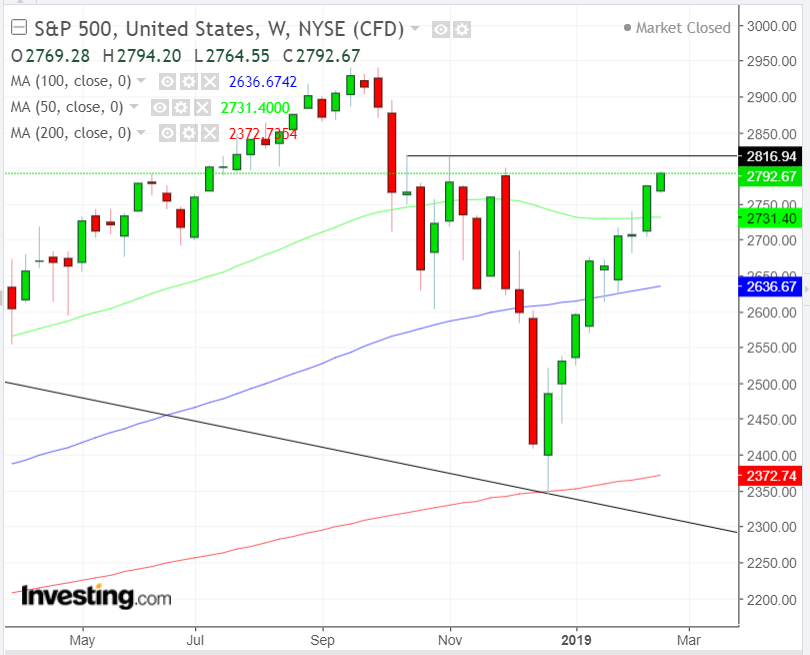
The S&P 500 advanced 0.64% on Friday, with Technology shares in the lead (+1.28%) and Consumer Staples lagging (-0.48%). For the week, the index gained slightly less, up 0.62%, with defensive Utilities shares outperforming (2.41%), followed closely by trade proxy-sector Materials (+2.39%). Interestingly, the other trade proxy-sector, Industrials was among the laggards (+0.69%).
Technically, the SPX climbed higher for the fourth straight week and a fourth consecutive weekly gain, nearing the 2,816.94 resistance of the mid-October peak, the highest level since reaching the 29,000 level, the September peak and record. The index has also advanced for eight out of the last nine weeks, adding a total of 15.56%.
The Dow Jones Industrial Average climbed 0.7% on Friday to finish the trading week, for a weekly gain of 0.57% the mega cap index's ninth consecutive weekly boost, its longest weekly winning streak since 1995, almost 24 years. The next test for the short-term rally: the 26,277.82, November peak, the highest level since the 30-component index fell below its September, 27,000 record-peak; it advanced 16.07% overall since the rally began.
The NASDAQ jumped 0.91% on Friday and 0.74% during the course of the trading week, for its ninth consecutive gain, adding a total of 18.86%.
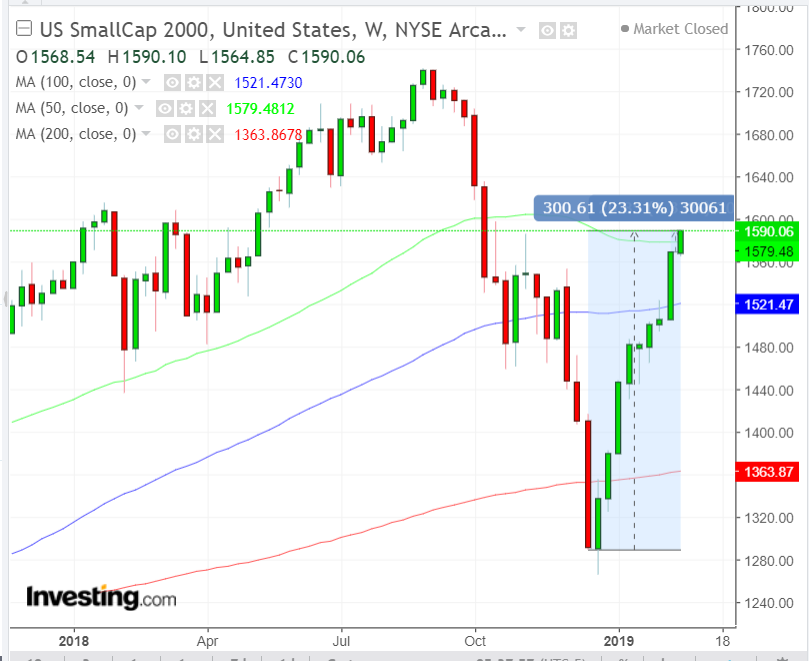
The Russell 2000 surged on Friday, up 1.06%. It also outperformed for the week, notching an additional 1.33%. It also outperformed among the major U.S. averages for its 9th weekly rally, gaining 23.31%.
We have been saying for some time now, and we're saying it yet again: U.S. small caps are doing something they should not when the rest of the market is acting according to the narrative that trade is the headwind everyone keeps saying it is. At this juncture, with a possible trade war settlement in site, investors should be rotating out of small caps, a place where—one would assume— they were parking their money when the trade risks were high, since tariffs wouldn't hurt profits of domestic stocks.
The fact that small caps continue to strongly outperform suggests that there's something else going on here. We just don't yet know what.
Ranging Treasury Yields Set to Fall?
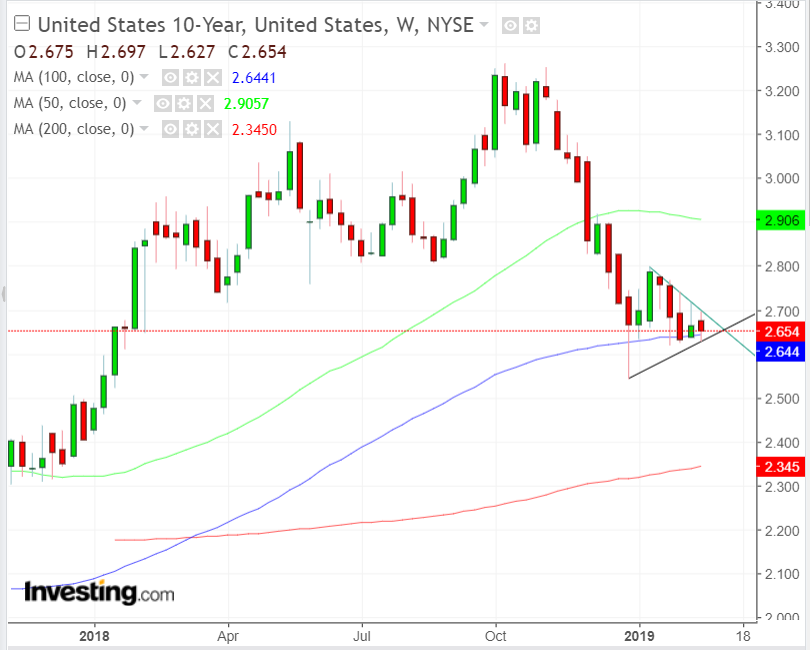
Another warning sign that something is amiss: Treasury yields, including for the benchmark 10-year note, have been ranging instead of jumping even though this is supposed to be a risk-on market given the current performance of equities.
One would expect that investors would be rotating out of the safety of bonds and into riskier equity assets, given the massive advance since after Christmas. Why then are yields lower than they were before the rally started?
Furthermore, the technical setup, a symmetrical triangle following the drop since the Oct. 8, 3.256% level, which is held together by the 100 DMA, after falling below the 50 DMA, suggest yields will fall further, toward the 200 DMA above the 2.3% level. That would happen if investors rushed to protect their capital in the safety of Treasuries, after taking them out of equities. Which would mean stocks were set to plunge.
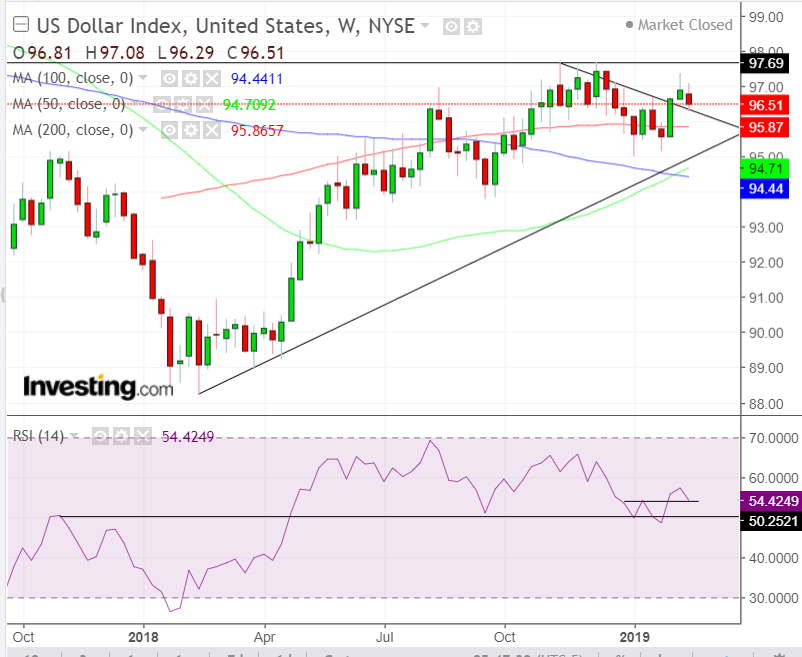
The dollar, alongside yields, dropped for the week after Treasury Secretary Steven Mnuchin said the two sides in the U.S.-Sino trade dispute had reached a final currency agreement. Technically, the decline followed a weekly shooting star, but the dollar-index still remained above the former downtrend line since November. The RSI found support at the neckline of a double-bottom, at the support that goes back to a November 2017 resistance.
The weaker dollar paved the way for emerging market stocks to increase for a fifth day, their longest streak since May.
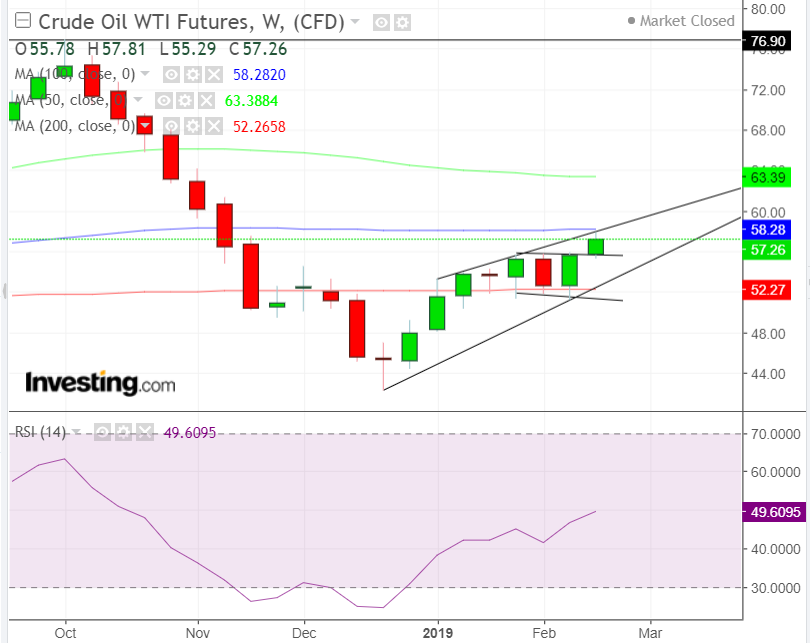
Oil prices advanced at the end of the week, moving past the $58 mark. As such, one might expect sellers to defend the $60 level.
On the other hand, the Vitol Group, the world's largest energy and commodity traders, expect prices to continue climbing, thanks to events in Venezuela and production cuts by OPEC causing shortages.
Tecnically, prices broke out of a three-week congestion, suggesting a technical chain reaction would propel WTI higher. On the other hand, the price retreated after touching the 50-WMA. In addition, the post-Christmas rally, in tandem with equities, is developing a rising wedge. This is, in fact, bearish in the downtrend, from the $76.90 October peak. It's also the highest level since November 2014.
Week Ahead
All times listed are EST
Monday
8:30: U.S. – Chicago Fed National Activity Index (January): forecast to fall to 0.1 from 0.27.
Tuesday
2:00: Germany – GfK Consumer Confidence (March): forecast to remain at 10.8.
8:30: U.S. – Housing Starts and Building Permits (December): Starts to fall to a negative 0.5% from 3.2 percent MoM and permits to fall 1.290M from 1.322MMoM.
Wednesday
5:00: Eurozone – Business Confidence (February): forecast to fall to 0.63 from 0.69.
8:30: Canada – CPI (January): prices expected to remain 1.7% YoY.
10:00: U.S. – Pending Home Sales (January): sales expected to jump to -0.4% from -2.2% MoM and 11% YoY.
10:30: U.S. – EIA Crude Inventories (w/e 22 February): stockpiles likely rose by 3.080 million from 3.672 million barrels.
20:00: China – Manufacturing and Non-Manufacturing PMI (February): Manufacturing PMI to hold at 49.5, while Non-Manufacturing falls to 54 from 54.7.
Thursday
8:00: Germany – CPI (February, preliminary): CPI to rise 1.5% YoY, from 1.4
8:30: U.S. – GDP (Q4): QoQ growth rate to be 2.4% from 3.4%.
9:45: U.S. – Chicago PMI (February): index to rise to 57.5 from 56.7.
20:45: China – Caixin Manufacturing PMI (February): expected to rise to 48.5 from 48.3.
18:30: Japan – Unemployment Rate (January): expected to hold at 2.4%.
Friday
00:00: Japan – Consumer Confidence (February): forecast to fall to 41.3 from 41.9. Market to watch: JPY crosses
3:55: Germany - Unemployment Change (February): expected to further fall to -5K from -2K.
4:30: U.K. – Manufacturing PMI (February): index to fall to 52.0 from 52.8.
5:00: Eurozone – CPI (January, flash): YoY CPI to be 1.5%, and core 1.1%.
5:00: Italy – Government Presents Budget: the budget argument between Rome and Brussels goes on, and if this budget suggests higher spending in Italy we may see a fresh round of disagreement.
8:30: Canada – GDP (Q4): QoQ rate to be 0.4% from 0.5%.
8:30: U.S. – Personal Spending (December): expected to fall to - 0.2% MoM from 0.4%.
10:00: U.S. – ISM Manufacturing PMI (February): forecast to fall to 55.9 from 56.6.

