- Irrespective of headlines and volatility, stocks withstand shocks, suggesting investors remain committed
- Dollar falls after yields slip, pushing gold higher
- Will oil stay above $68?
- How low can Bitcoin go?
Despite escalating trade war fears, the US economy has been getting stronger and stocks have repeatedly wiped out most of their trade-related losses. That pattern was evident yet again last week. As such, we remain bullish on equities until markets provide reason to believe otherwise.
Though small caps were the sole gainers over the course of the week, with US stocks declining on trade tensions and concerns over growth on potentially higher inflation and interest rates, nevertheless, the Dow Jones Industrial Average reversed its eight day straight slide on Friday, finishing the week up 0.49%. The S&P 500 squeaked higher on the final day of trade as well, finishing up 0.19%.
All this suggests equity investors either don't expect a full-on trade war, choosing instead to either view the headlines as mere negotiating tactics on both sides, or, if a full-fledged trade spat does materialize, investors seem to be signaling they don't believe it will have a lasting impact on the US.
The dollar, however, was less buoyant. It was dragged down by falling yields as market volatility increased. Not surprising then that safe havens gold and the Japanese yen both firmed.
Volatility Drives Bond Prices Higher, US Dollar Lower
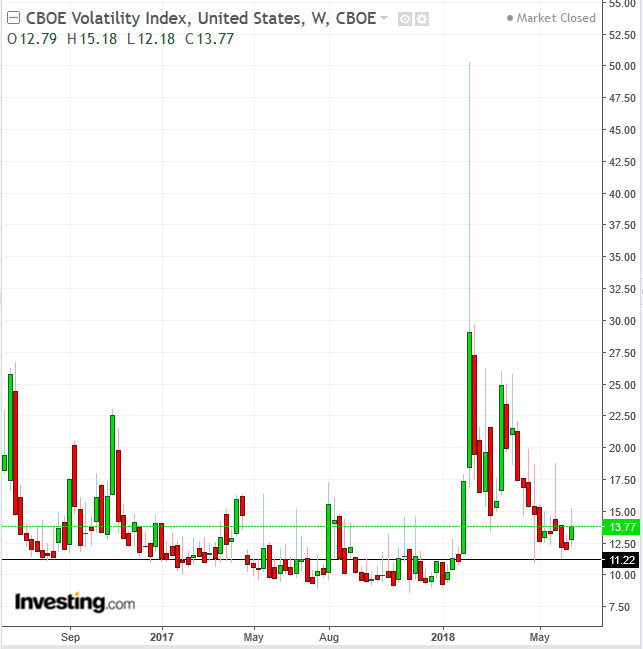
As the week drew to a close, traders increased bets on additional volatility, pushing the VIX to the highest close since late April, but still beneath the levels seen in late January-early February that continued till late April, the first double-digit correction since February 2016. After two short stints of lower volatility—which touched some of the levels seen throughout most of 2017—the 'fear' gauge is back to the highest levels of last year.
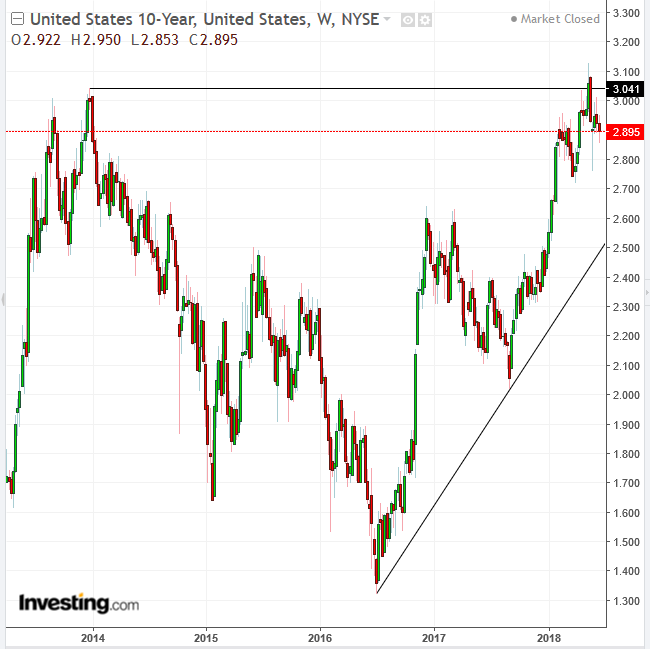
Accordingly, investors have been increasing bond demand, pushing yields lower. The 10-year yield swung between 2.8 bp or 0.97 percent up and 6.7 bp or 2.3 percent down, to settle at 2.3 bp or -0.9 lower.
From a technical perspective, demand has been slipping since mid-2016, propelling yields higher. However, yields have been struggling beneath the 3.04 level since mid-February, the highest point since December 2013. Should its current course persist, reaching higher levels, it would signal the official end of the 30-year, bond bull market.
That would happen when investors rotate additional funds out of bonds and into stocks. On the other hand, should equities enter a significant correction, as many analysts are warning, the rising demand for Treasuries would push yields below the uptrend line since July of last year, increasing the potential for yields to continue falling below the July 1.697 low; that would mean a resumption of the bond bull market.
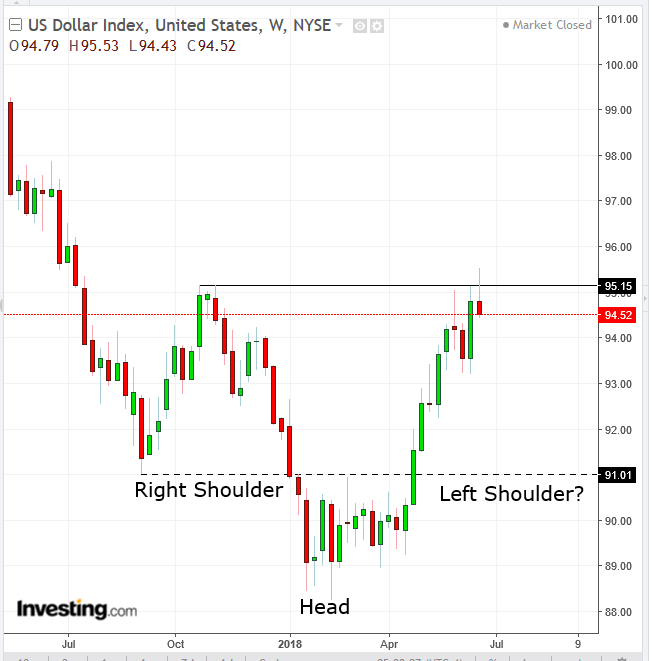
Despite obvious interest rate differentials that would favor the dollar, the global reserve currency gave up a 0.75 percent increase last week to finish with a 0.3 percent loss, sliding in tandem with Treasury yields. Technically, the USD met with resistance at the key 0.95 percent level, the highest price since October.
The rise during the week, but a lower close, formed a shooting star, compounding the resistance at that level. The pattern that has been forming since October is consistent with an H&S bottom reversal, which, if it completes, would imply a return above 102 to the January levels, before Trump told the Wall Street Journal that a too strong dollar “is killing us.”
The dollar's slide boosted the price of gold by 0.15 percent.
Global Trade Narrative Continues To Garner Attention
Investors are divided over the long-term impact of the one geopolitical event traders have been paying the most attention to since March, the global trade war. While China is the focus of US angst, the administration has targeted other Asian countries as well as European trading partners, focusing especially on Germany and US neighbors Canada and Mexico.
Though it might initially appear that a trade war would kill the first synchronized growth since the crash of 2008 and the Great Depression that followed, deeper consideration reveals a picture that's far less black and white. To begin with, the inaugural $50 billion worth of tariffs announced by the US—which were then matched by China—are merely an announcement that has not yet been put into effect. That will require a protracted, several-step process before actual levies could be collected, which could easily take months, allowing plenty of time for both countries to renegotiate better positions, or even a face saving solution to end the hostilities.
Second, the $200 billion of exports targeted for tariffs represent roughly just 1 percent of US GDP. That's a drop in the global trade bucket, hardly enough to break the global trade mechanism.
As well, despite 15 weeks of a 'trade war' so far, unemployment has dropped to 3.8 percent, the lowest level in 18 years. Prior to 2000, the last time the US had such a low unemployment rate was in 1969. Very gradual wage growth completes the picture of a sustainable, Goldilocks economy, topped by high consumer confidence.
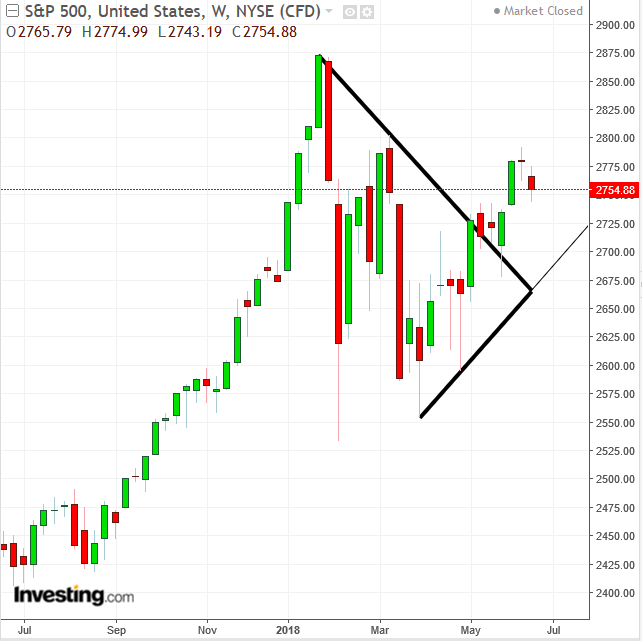
Even stocks, which have been most dominated by the ongoing trade war narrative, last week wiped out all earlier losses fueled by that particular catalyst. Notwithstanding last week’s 0.89 percent S&P 500 decline—led by Industrials (-3.34) and Materials (-2.03), clearly demonstrating the reason for the selloff is trade—the index still remains 1.15 percent from the very highest level of March, before the trade selloffs began.
The SPX's trend is still clearly up since the February lows and prices are still well above a symmetrical triangle, a consolidation in which demand absorbed all the supply and continued higher.
The Dow Jones Industrial Average, whose mega cap multinational companies are the most reliant on overseas markets for growth, has taken the hardest beating over trade, falling almost 500 points or 2.00 percent, extending a selloff to its second week and an aggregate 755 point or 3 percent loss. Nevertheless, even the 30 component index is still in an uptrend from the February low. It too has wiped out most of its trade-related decline.
The NASDAQ Composite fell 0.7 percent on the week but is still 1.4 percent above its highest point before the trade selloff. And the Russell 2000—the mirror image of the Dow because of its small cap firms which rely more on domestic rather than global trade—has actually advanced 0.1 percent last week, gaining for the eighth straight week, for a total of 8.3 percent.
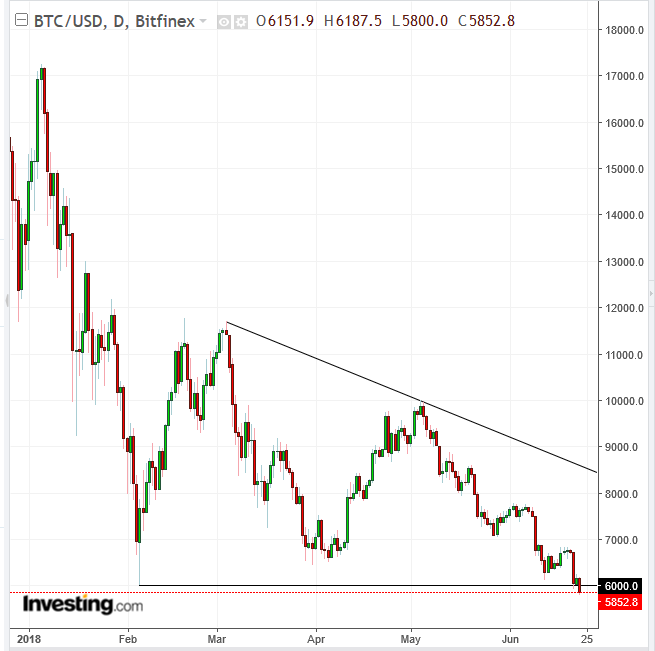
One asset that continues to struggle is Bitcoin. The most popular cryptocurrency by market cap fell below the February, $6000 low, to $5,852.8 where, at time of writing, it was trading at the bottom of the session.
The decline provided a downside breakout to a massive, almost 5-month descending triangle, as consolidation, in which supply has drowned out all the demand within the pattern and where sellers were forced to seek willing buyers at lower prices. Should prices deepen the downward penetration, they would signal much steeper losses.
The Week Ahead
All times listed are EDT
Monday
4:00: Germany – IFO Index (June): business climate index expected to fall to 101.7 from 102.2.
Tuesday
10:00: US – Consumer Confidence (June): expected to hold at 128.
Wednesday
8:30: US – Durable Goods Orders (May): expected to rise 0.2% from -1.7% MoM, core durable goods orders forecast to rise 0.5% from 0.9%.
10:00: US – Pending Home Sales (May): forecast to rise to 0.6% from -1.3% MoM.
10:30: US – EIA Crude Inventories (w/e 22 June): stockpiles expected to fall by 5.1 million barrels after falling 5.9 million barrels a week earlier.
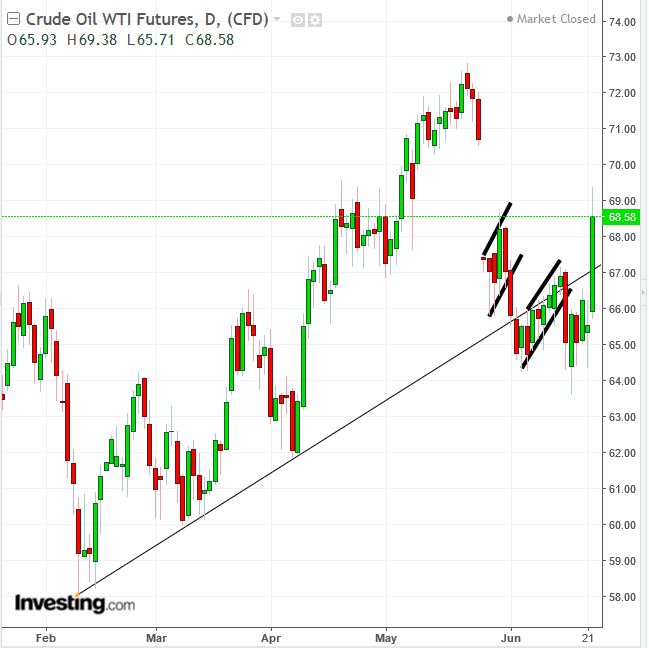
On Friday, after OPEC and Russia closed a deal to increase production by a total of 1 million barrels per day, oil jumped, rising a whopping 5 percent though it settled at a 4.5 percent gain for the day. That production increase was less than what some analysts have been expecting.
Technically, the leap broke the selling pressure of two consecutive flag patterns. The commodity climbed back above its uptrend line since February 11. The test this coming week will be whether it will stay above the uptrend line; the test for the coming month is whether oil will post a fresh high, above the May 22 peak, under $73.
Thursday
5:00: Eurozone – Business Confidence (June): forecast to fall to 112 from 112.5.
8:00: Germany – CPI (June, preliminary): expected to fall to 1.9% from 2.2% YoY. Market to watch: EUR crosses
8:30: US – GDP (Q1, final), Initial Jobless Claims (w/e 23 June): growth expected to be 1.2% YoY and 0.1% QoQ. Jobless claims to rise to 219K from 218K.
19:30: Japan – Unemployment (May): forecast to remain at 2.5%.
The USD/JPY has been falling since December 2016. Last week’s decline upon approaching the falling channel-top, under the 111.00 price level confirms a supply line from mid-May. Should prices fall below 108, a support-resistance line since April 2017, it would complete a double top reversal, propelling prices to rest the 105.00 level before it extends the downtrend.
Friday
7:55: Germany – Unemployment (June): unemployment rate to remain flat at 5.2%.
8:30: UK – GDP (Q1, final): growth expected to be 1.2% YoY and 0.1% QoQ.
9:00: Eurozone – CPI (June, flash): inflation expected to be 1.7% YoY from 1.9%, and core CPI to rise to 1.2% from 1.1% YoY.
12:30: US – Personal Income and Spending (May): income to rise 0.4% from 0.3% MoM, and spending to rise 0.4% from 0.6% MoM.
9:45: US – Chicago PMI (June): index forecast to fall to 60.1 from 62.7.
