This article was written exclusively for Investing.com
- Processing spreads: real-time indicator of demand
- Crude oil recovered, but crack spreads remained weak
- Oil falls with the stock market; refining spreads continue to point to weakness
- Seasonally weak time of the year, but other compelling factors point to higher prices
A crack spread reflects the processing or refining margin for those companies that take a barrel of crude oil, pass it through a catalytic cracker, which turns the petroleum into oil products like gasoline and distillates.
The international crude oil market is sensitive to a complex collection of geopolitical, fundamental, and technical factors. When it comes to supply and demand fundamentals, the term structure of the oil market or the price differential between different delivery periods tells us if the market is in a glut or deficit of reserves.
Quality and location spreads like the price difference between the two benchmark crude oils, Brent and West Texas Intermediate, provide insight into worldwide production as well as the demand for specific oil products, as Brent is more suitable for processing into distillates. WTI’s lower sulfur content makes it a preferable choice for refining into gasoline.
Crack spreads are another significant factor when it comes to the path of least resistance for the price of crude oil, which is the input in the refining process. Over the past months, as the price of crude oil recovered, gasoline and distillate crack spreads remained under pressure, which was a warning sign for the energy commodity.
Processing spreads: real-time indicator of demand
Crack spreads are a real-time indicator in two senses. As crude oil is the primary ingredient in refining the energy commodity into gasoline and distillate products, it is a barometer of demand for the products and the raw crude oil.
The processing spreads are also an indicator of the day-to-day profitability for the refining companies that pass crude oil through catalysts where different temperatures create the various oil products. Rising crack spreads tell us that refinery profits are increasing and that crude oil demand is robust. Declining crack spreads have the opposite impact when it comes to the demand for raw petroleum and refinery earnings. In 2020, the refining spreads have been trending lower—a sign of continued economic woes.
Crude oil recovered, but crack spreads remained weak
Crude oil prices moved higher since the lows in late April. The continuous NYMEX futures contract rose from below zero on April 20 to over $40 per barrel. Brent futures rose from $16, the lowest level of this century, to over $40 per barrel and were above that level at the end of last week. Meanwhile, even as the volatility in crude oil caused lots of price variance in the crack spreads, the gasoline and distillate spreads have been trading lower even as the price of crude oil recovered. 
Source, all charts: CQG
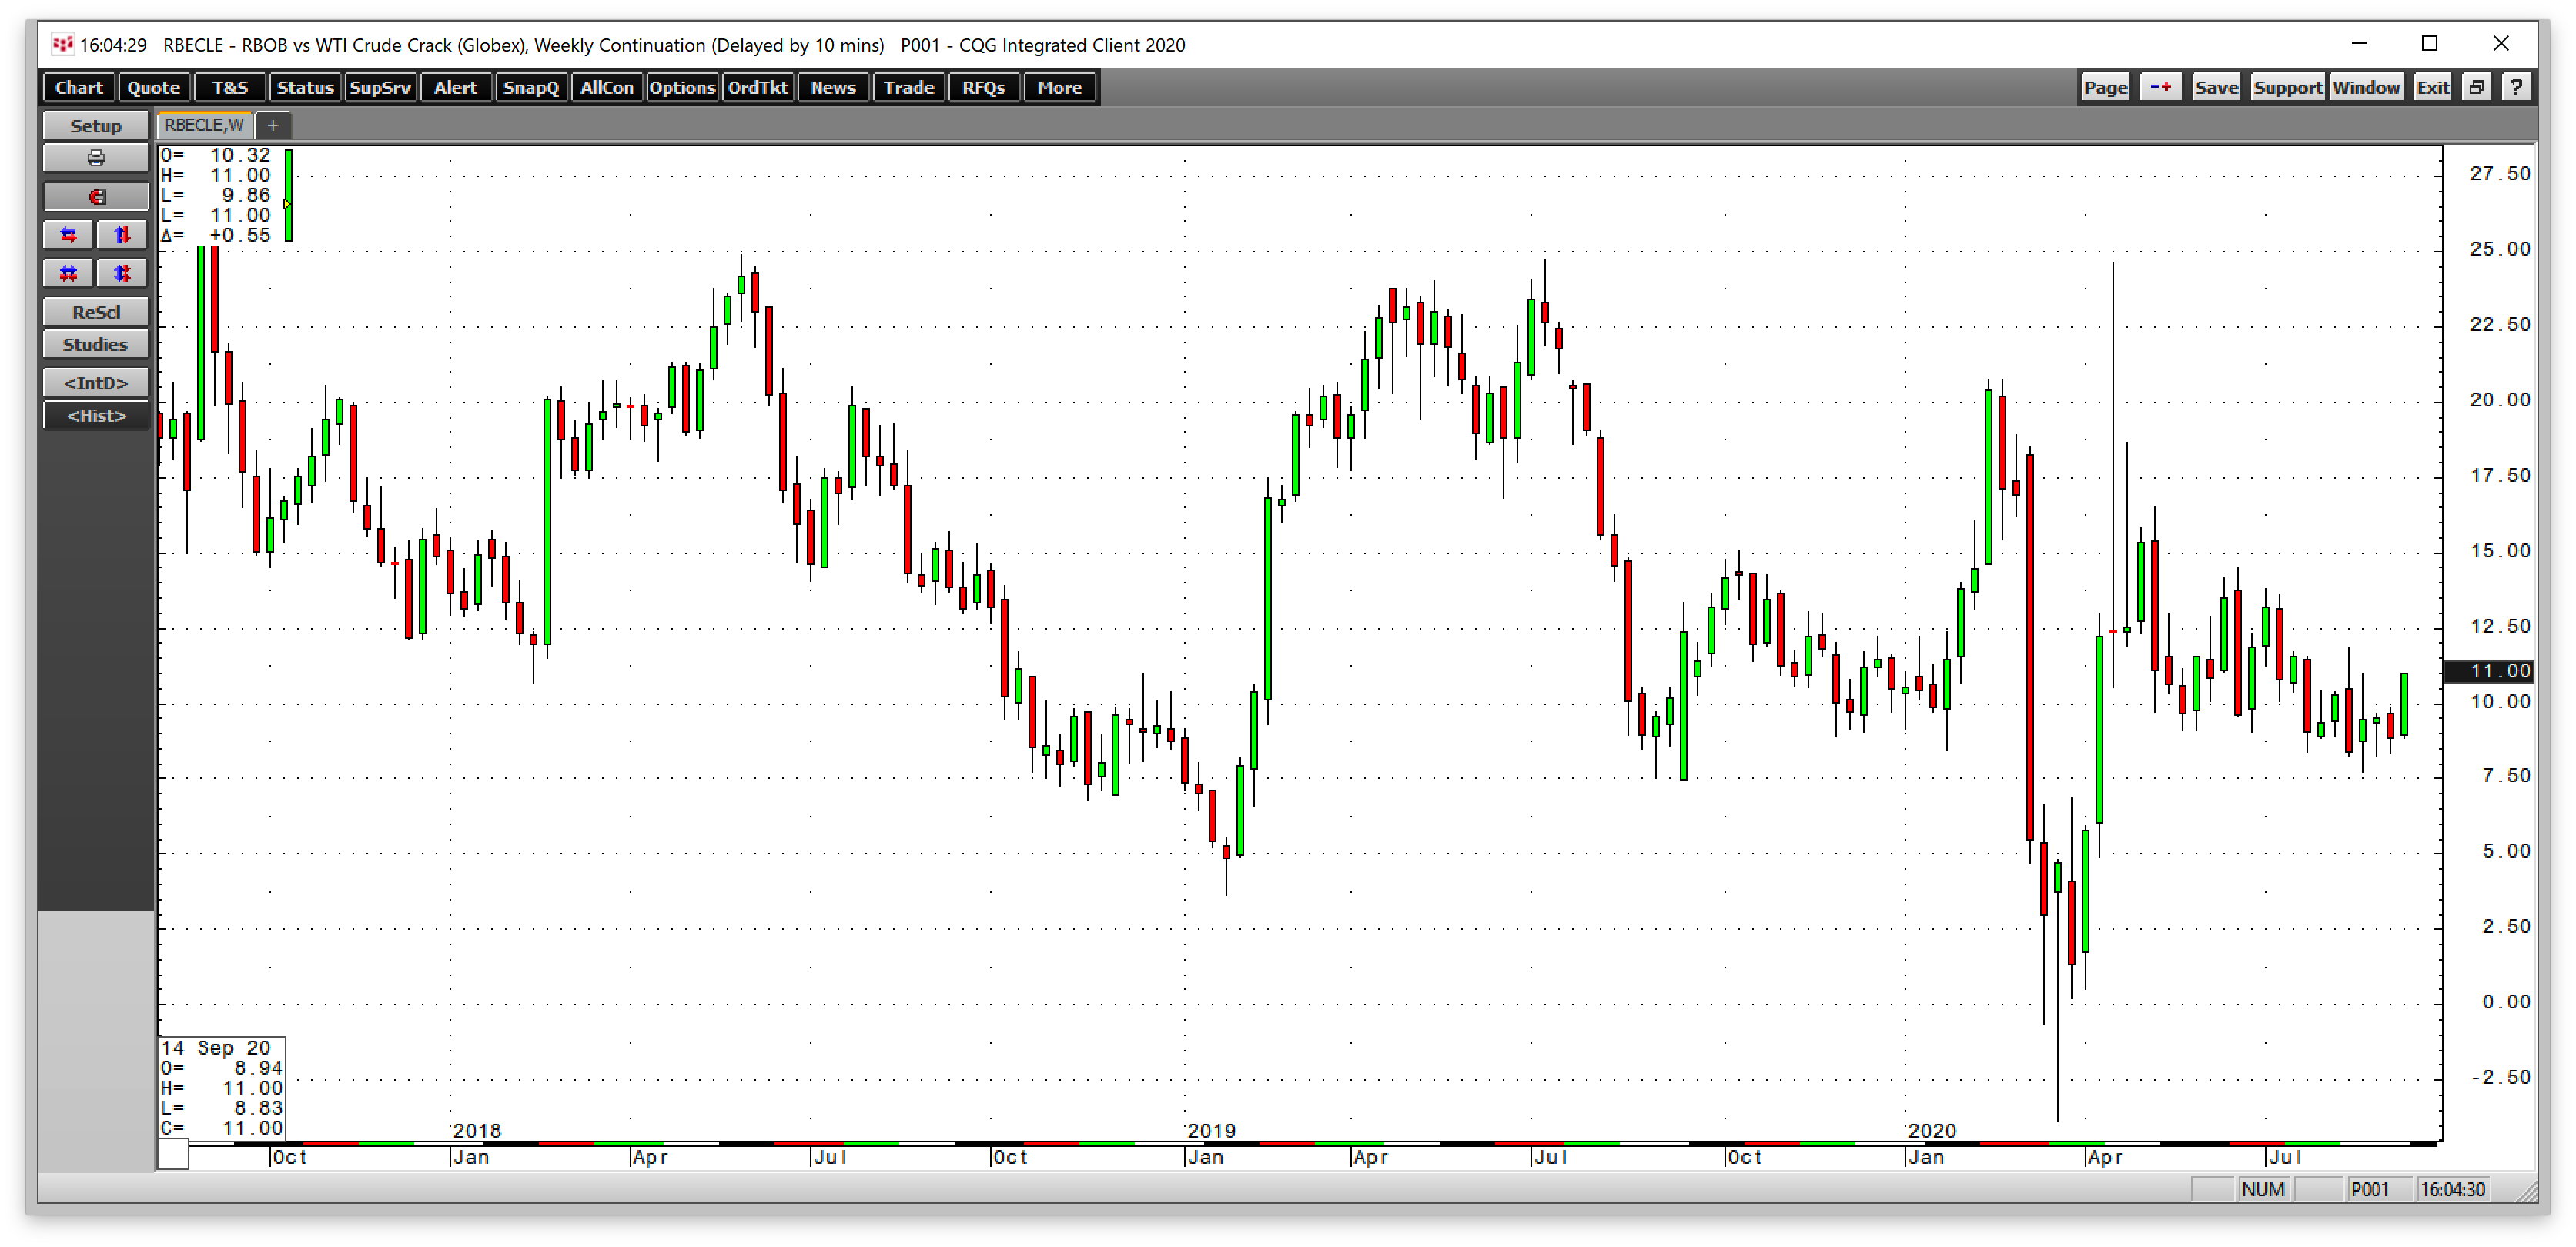
The gasoline crack spread chart, above, shows the range for 2020 has been from negative $3.85 to a high of $24.65 per barrel. The low occurred when demand evaporated during the height of risk-off conditions in March. The high came as crude oil plunged to below negative $40 per barrel on April 20. At around the $11.00 level at the end of last week, the gasoline crack has been trending lower since April, but was within last year’s range of $7.48 to $13.34 for the same week in 2019.

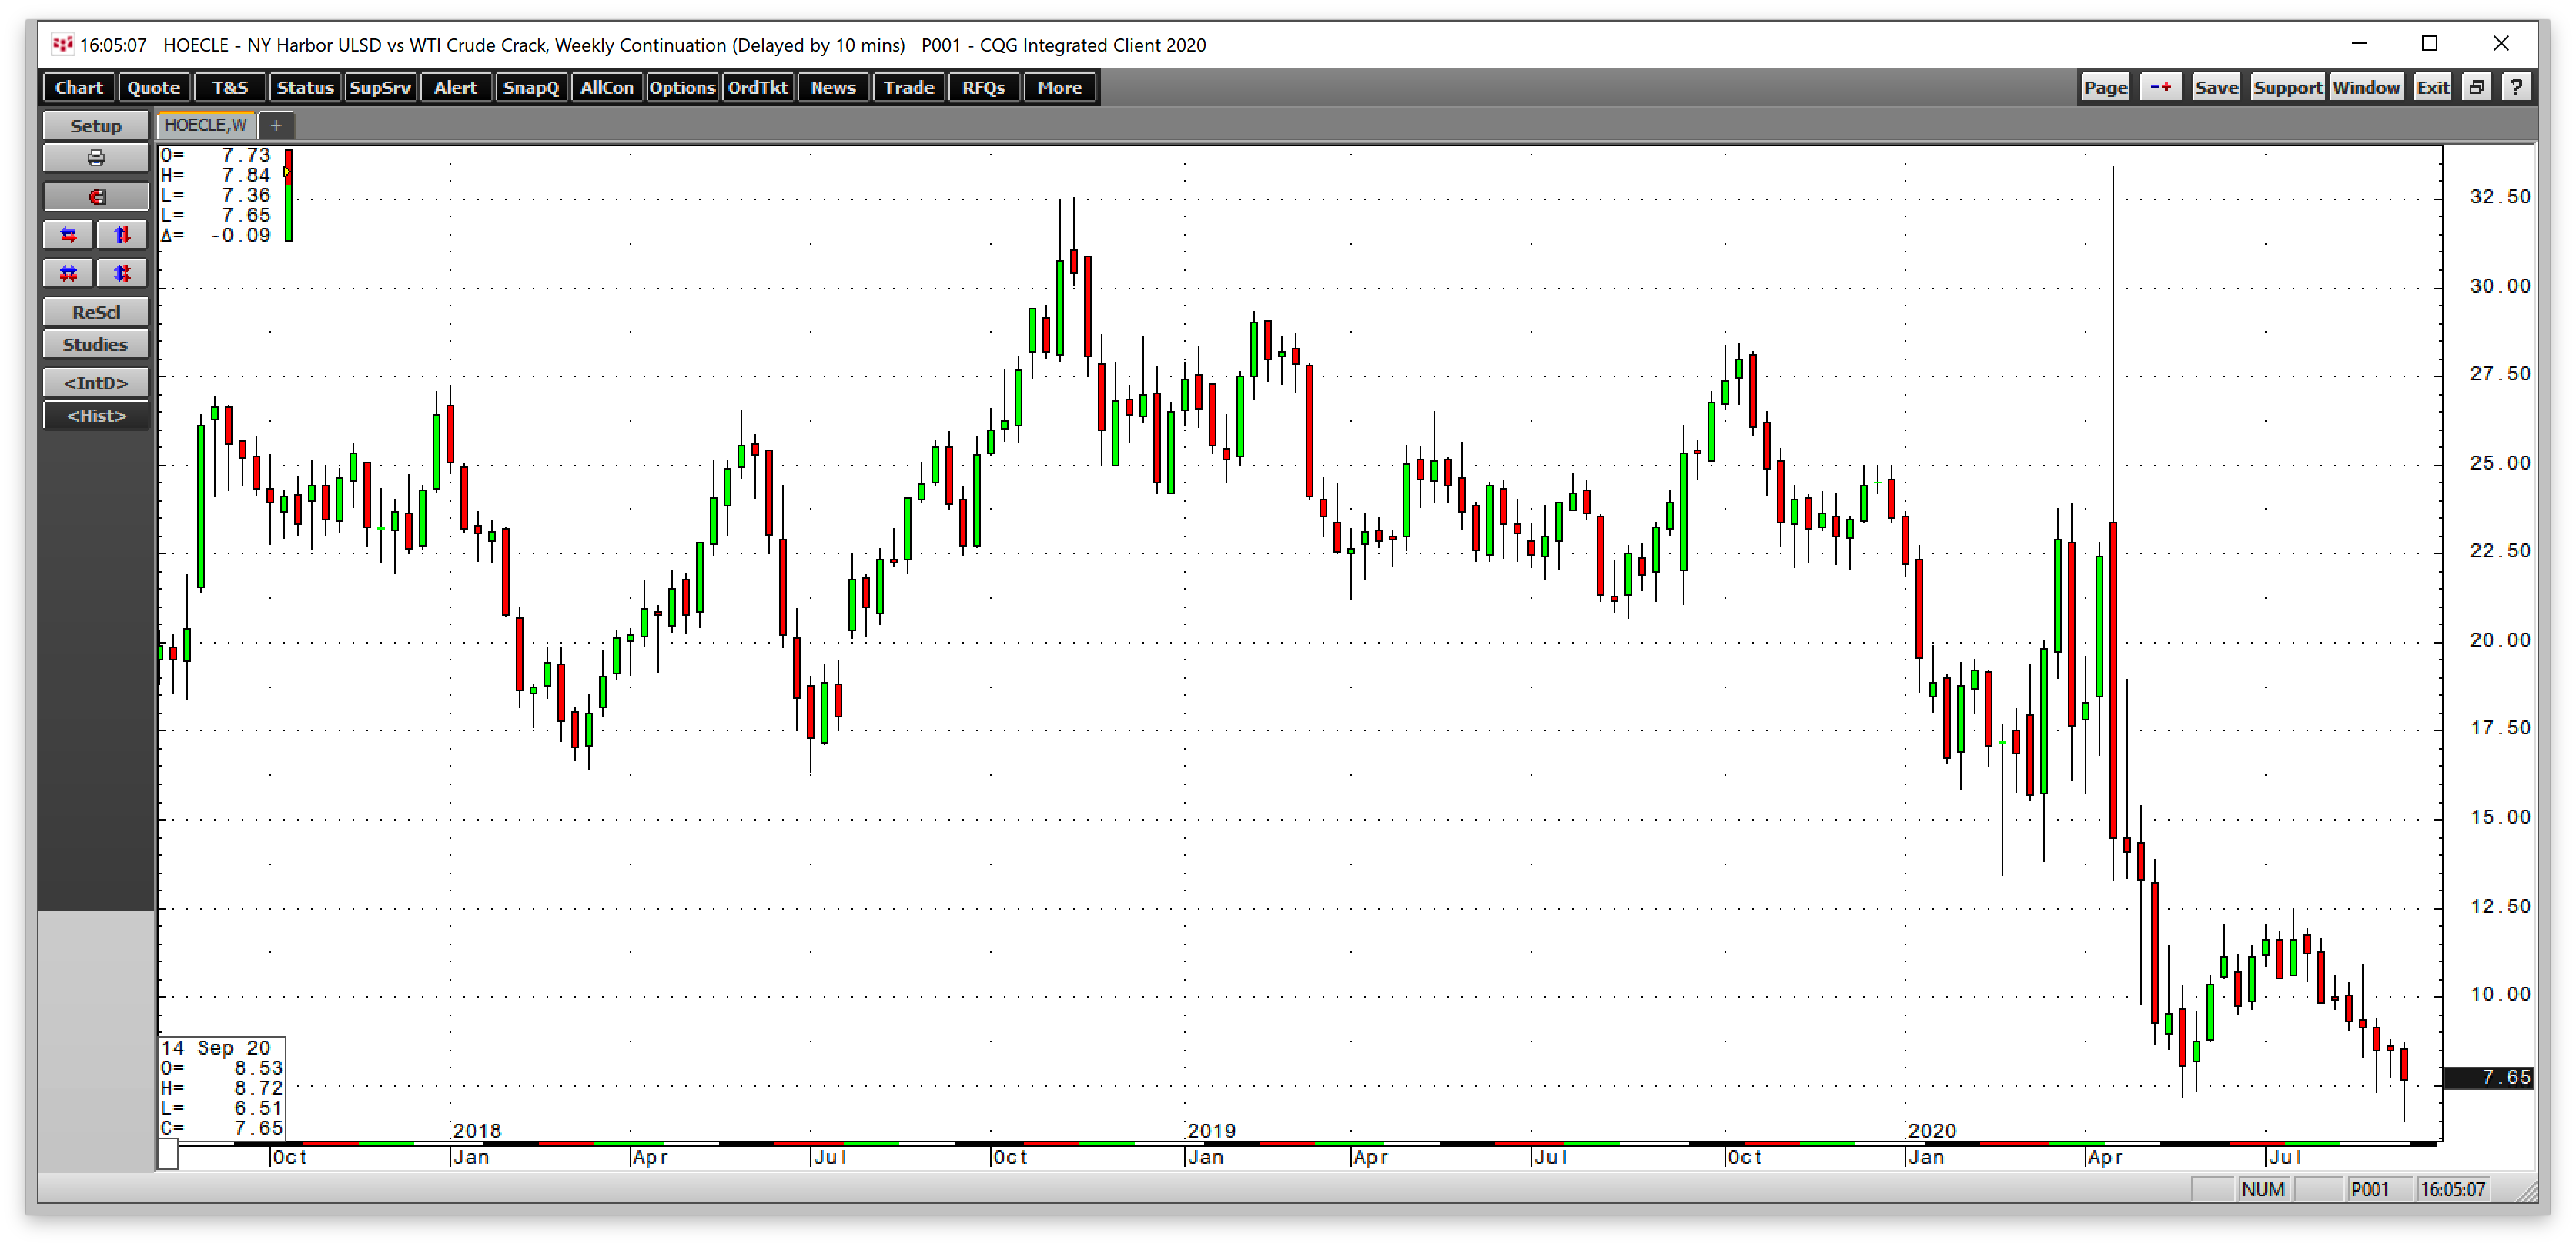
The heating oil crack spread is a proxy for other distillates, including diesel and jet fuels. The range in 2020 has been from $7.20 to $33.39 per barrel. At $7.65 at the end of last week, the distillate crack was substantially below last year’s range during the same week of $21.09 to $26.10 per barrel. Weak demand from the airline sector and sluggish economic conditions have caused the low level for the distillate crack spread that has been trending lower since late April.
Oil falls with the stock market; refining spreads continue pointing to weakness
The price of nearby October WTI futures on NYMEX traded above $39 per barrel from June 30 through Sept. 8. Last Friday, the price was back above $40 per barrel. Crude oil fell with the stock market in early September, but the price recovered.
Stocks had risen to record highs, but gravity hit the equity markets. Meanwhile, October crude oil futures reached a low of $36.13 on Sept. 8, but they held the next technical support level at $35.25, the mid-June low and moved back towards the highs by the end of last week.
The price action in the distillate crack spread continues to be a warning sign for the crude oil market. The low level compared to last year is a sign of economic weakness.
Seasonally weak time of year, but other compelling factors point to higher prices
When it comes to gasoline, we are entering the offseason for demand as the peak driving period in the US runs from late spring to late fall each year. The summer months tend to be the high-water mark for demand as drivers put more mileage on automobiles.
Therefore, weakness in gasoline and its refining spread should not be a surprise in mid-September, but the heating oil crack is another story. It points to overall weakness in the US and global economies.
Meanwhile, the economic weakness caused by the pandemic could turn out to be the most bullish factor for crude oil and all commodities. The world’s central banks and governments are flooding the financial system with unprecedented liquidity and stimulus. The price tag for rising deficits and money supply is inflation. The US Fed recently told markets they are willing to tolerate inflation above its 2% target.
At the same time, the dollar has been declining against other currencies since March. The current environment is a potent bullish cocktail for crude oil and all commodities.
Following the global financial crisis in 2008, WTI crude oil fell to a low of $32.48 per barrel. By 2011, the price was back over $100. The same pattern occurred in a host of raw material markets.
If the period of 2008 through 2011 is a model for 2020 and the coming years, the commodities asset class could be in for a multiyear bull market. In 2011, the gasoline crack spread peaked at over $40 per barrel after trading to almost negative $16 in 2008. The heating oil crack spread moved from a low of $2.42 during the second quarter of 2009 to a high of over $42 per barrel in 2011.
Keep an eye on those crack spreads. They are a significant barometer of demand for crude oil.
