


Sign up to create alerts for Instruments,
Economic Events and content by followed authors
Free Sign Up Already have an account? Sign In
Please try another search

Things have quieted a bit (but only a bit) in terms of the coronavirus crisis. As such, I thought it would be a good time to provide an update on this evolving situation. Let’s start with the trends in the spread of the virus to understand what they mean in the present for the markets, as well as in the future for the pandemic itself and the economy.
Although we continue to see case counts rising, that rise is unavoidable at this stage of the pandemic and will continue for some time. Expect it — and don’t assume it means that things are getting worse. Right now, the metric that signals whether things are getting better or worse is how quickly, in percentage terms, the cases are growing. Here, the news is better.
In the chart below, you can see that growth rates around the world are now at or below 10%. This number is not great. In fact, it implies that total cases will double in just over a week. But to put things in perspective, it is substantially better than the 15% of a week ago here in the U.S. (which doubled cases every five days) and the 30% of a couple of weeks ago (which doubled cases in less than three days).
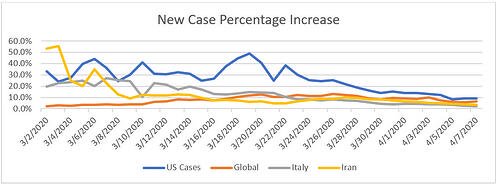
Another way to look at this chart is to view case growth as a representation of the steepness of the case growth curve. When we say “flattening the curve,” what we really mean is slowing the growth rate, which is just what we see above. As growth rates decline, the curve gets flatter and the likelihood of overloading the health-care system declines. Again, we are not out of the woods yet, but we are getting much closer. If current trends continue, we can reasonably expect to be turning the corner in the next month or so.
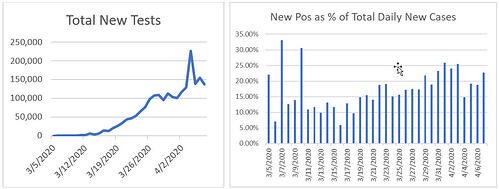
Other trends are positive as well. After a slow start, testing for the virus is now around 150,000 per day. There has been a slowdown in the growth rate in the past couple of days, but the testing rate should be poised to rise again in the next week. Again, it’s not where it should be, but it's much better than it was and likely to improve further.
Less good is the next chart, which shows the percentage of positive results on each day’s tests. The higher the positive results, the more the tests are being applied to confirm existing infections, rather than to find new infections or to establish population information to better manage the future control of the virus. The initial spike at the end of last month seems to have been due to expansion of confirmatory testing in New York City, as that cluster of cases hit high growth rates. The current rise seems to be due to other cities that are now hitting the expansion phase. We need greatly expanded testing to help determine population statistics; when the percentage of positive results gets back to the 10-15% range, it will be a good indicator that test availability is catching up with the need. That should come as the tests per day rise again, which takes us back to the first chart.
These charts provide the underlying rationale for many of the current headlines, which are now speculating about peak virus and how the pandemic is being brought under control. As usual, the headlines are ahead of themselves. We can see from the first chart that U.S. cases are still rising at 9% per day. So, cases will keep rising, and the new cases per day are set to double in the next eight days. Similarly, while testing availability is much better, it’s still not where it needs to be. Don’t get too excited by the headlines just yet.
The takeaway from the data so far is that we have made meaningful progress in controlling the virus: we know what to do, we are doing it, and it is working. We are, however, only about halfway through the process at best. If current trends persist, we are still several weeks away or more from seeing new infections drop to zero.
The difference between now and the start of the pandemic is that we can at least see the end. We can see that we have flattened the curve, and we can reasonably project when the pandemic will be brought under control. We are not at that point yet, but at least we can see it. And that is a very positive takeaway from the data thus far.
Disclaimer: Certain sections of this commentary contain forward-looking statements that are based on our reasonable expectations, estimates, projections, and assumptions. Forward-looking statements are not guarantees of future performance and involve certain risks and uncertainties, which are difficult to predict. Past performance is not indicative of future results. Diversification does not assure a profit or protect against loss in declining markets. All indices are unmanaged and investors cannot invest directly into an index. Member FINRA/SIPC. Commonwealt
Stocks finished the day sharply lower for a second day in a row, with the S&P 500 dropping by 1.2% and the NASDAQ dropping by 1.65%. The S&P 500 opened higher, but the...
A stronger-than-expected retail sales data from the US cemented the idea that the US economy remains too strong for the Federal Reserve (Fed) to cut the rates in summer. Retail...
Artificial intelligence (AI) and Bitcoin were top of mind at last week’s Paris Blockchain Week, where I had the privilege of presenting to an enthusiastic crowd. The...
Are you sure you want to block %USER_NAME%?
By doing so, you and %USER_NAME% will not be able to see any of each other's Investing.com's posts.
%USER_NAME% was successfully added to your Block List
Since you’ve just unblocked this person, you must wait 48 hours before renewing the block.
I feel that this comment is:
Thank You!
Your report has been sent to our moderators for review
Add a Comment
We encourage you to use comments to engage with other users, share your perspective and ask questions of authors and each other. However, in order to maintain the high level of discourse we’ve all come to value and expect, please keep the following criteria in mind:
Enrich the conversation, don’t trash it.
Stay focused and on track. Only post material that’s relevant to the topic being discussed.
Be respectful. Even negative opinions can be framed positively and diplomatically. Avoid profanity, slander or personal attacks directed at an author or another user. Racism, sexism and other forms of discrimination will not be tolerated.
Perpetrators of spam or abuse will be deleted from the site and prohibited from future registration at Investing.com’s discretion.