So, the big question on every investor’s mind is “What Comes Next?” Since this is not an advisory service (and given the fact that I am not too good at predicting the future anyway) I have avoided commenting on “the state of the markets” lately. That being said, I do have a few “thoughts”:
*The major averages (as of this exact moment) are still mostly above their longer-term moving averages (200-day, 10-month, 40-week, and so on and so forth). So, on a trend-following basis the trend is still “up”.
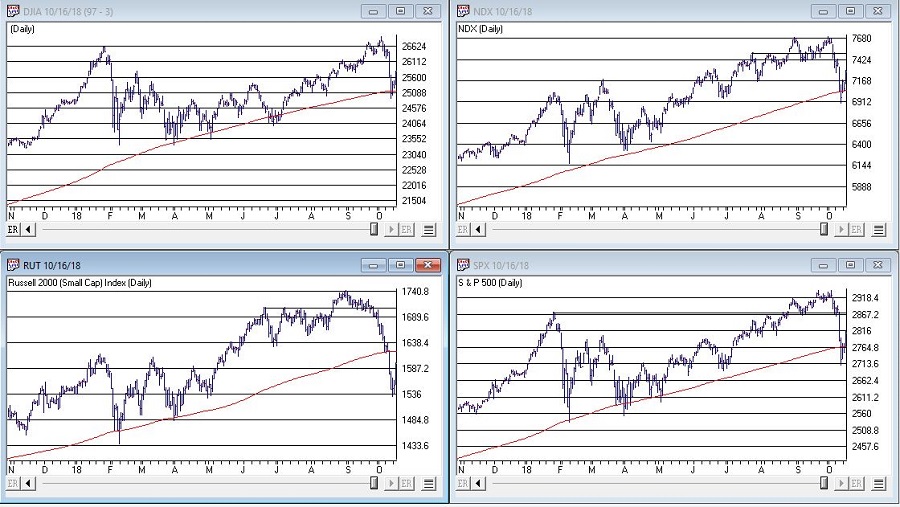
Figure 1: Courtesy AIQ TradingExpert
*We are in the most favorable 15 months of the 48-month election cycle (though off to a pretty awful start obviously) which beings Oct.1 of the mid-term year and ends Dec. 31st of the pre-election year.
*Investors should be prepared for some volatility as bottoms following sharp drops usually take at least a little while to form and typically are choppy affairs. One day the market is up big and everyone breathes a sigh of relief and then the next day the market tanks. And so on and so forth.
An Indicator to Watch
At the outset let me state that there are no “magical” indicators. Still, there are some that typically are pretty useful. One that I follow I refer to as Nasdaq HiLoMA. It works as follows:
A = Nasdaq daily new highs
B = Nasdaq daily new lows
C = (A / (A+B)) * 100
D = 10-day moving average of C
C can range from 0% to 100%. D is simply a 10-day average of C.
Nasdaq HiLoMA = D
Interpretation: When Nasdaq HiLoMA drops below 20 the market is “oversold”.
Note that the sentence above says “the market is oversold” and NOT “BUY NOW AGGRESSIVELY WITH EVERY PENNY YOU HAVE.” This is an important distinction because – like most indicators – while this one may often give useful signals, it will occasionally give a completely false signal (i.e., the market will continue to decline significantly).
A couple of “finer points”:
*Look for the indicator to bottom out before considering it to be “bullish”.
*A rise back above 20 is often a sign that the decline is over (but, importantly, not always). Sometimes there may be another retest of recent lows and sometimes a bear market just re-exerts itself)
*If the 200-day moving average for the Dow or S&P 500 is currently trending lower be careful about using these signals. Signals are typically more useful if the 200-day moving average for these indexes is rising or at least drifting sideways rather than clearly trending lower (ala 2008).
Figures 2 through 8 displays the S&P 500 Index with the Nasdaq HiLoMA indicator. Click to enlarge any chart.
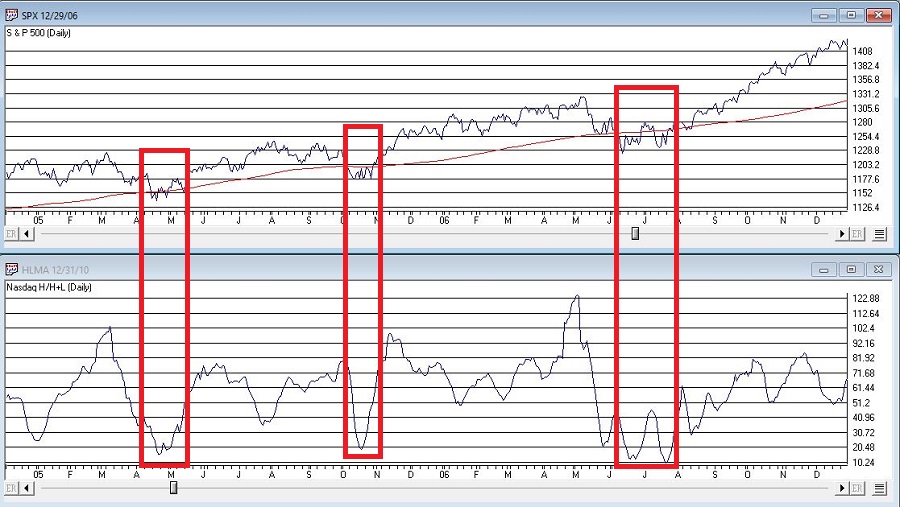
Figure 2: Courtesy AIQ TradingExpert
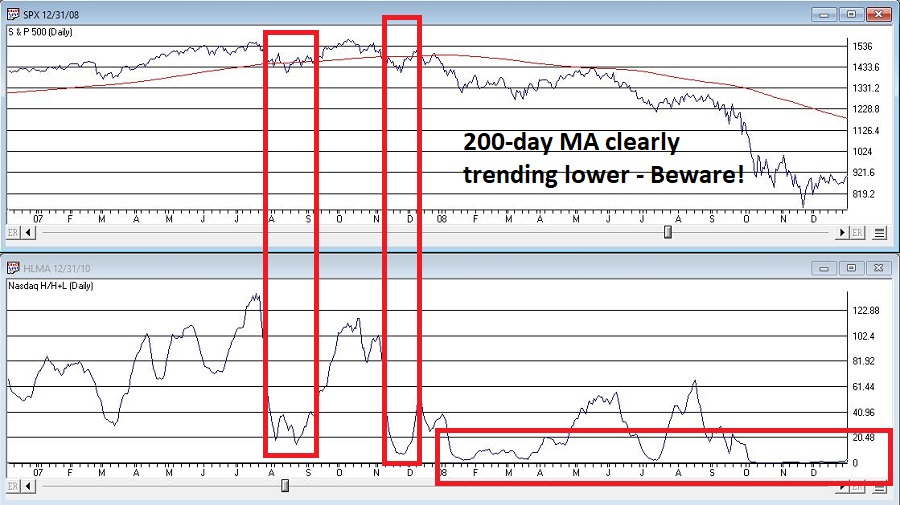
Figure 3: Courtesy AIQ TradingExpert
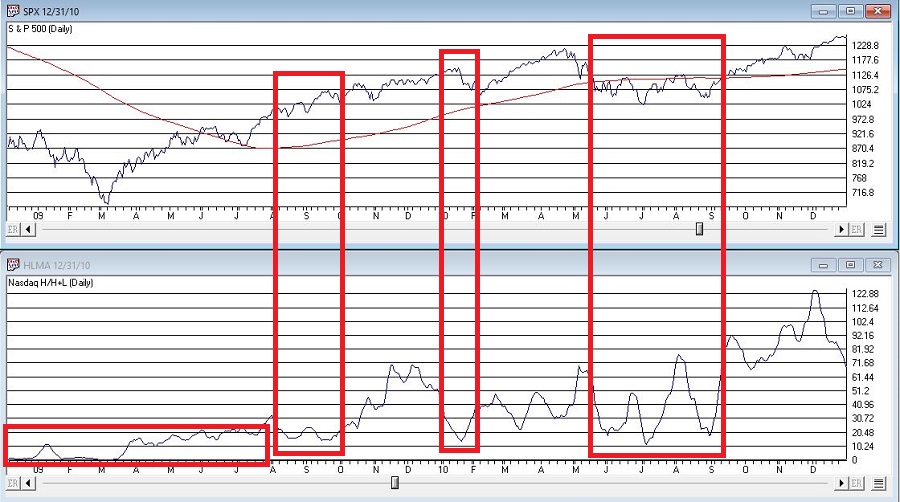
Figure 4: Courtesy AIQ TradingExpert
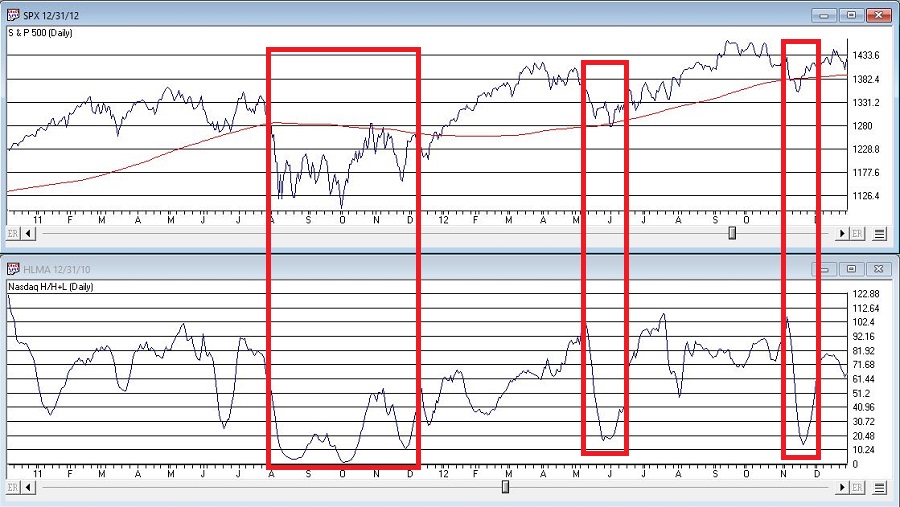
Figure 5: Courtesy AIQ TradingExpert
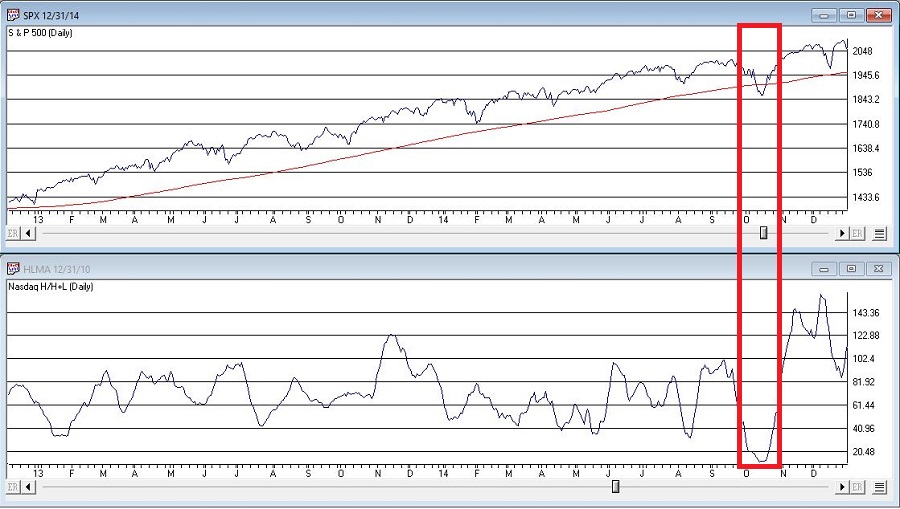
Figure 6: Courtesy AIQ TradingExpert
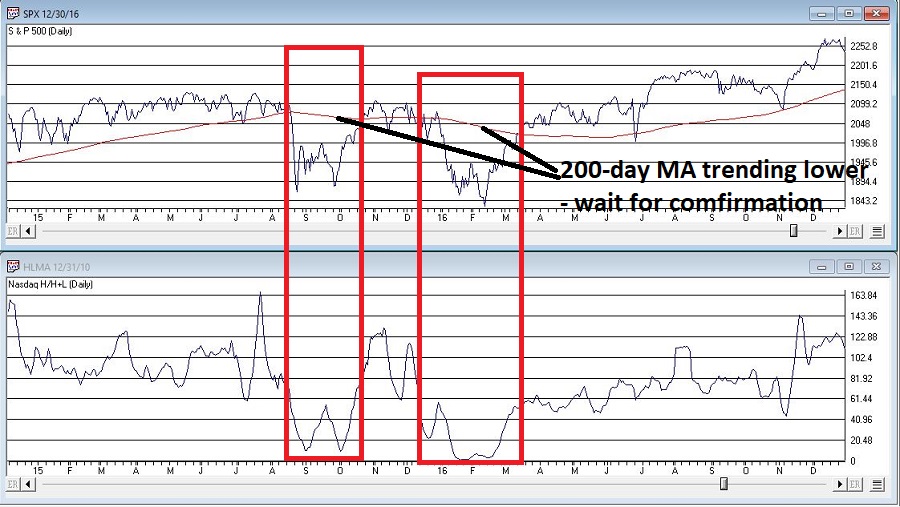
Figure 7: Courtesy AIQ TradingExpert
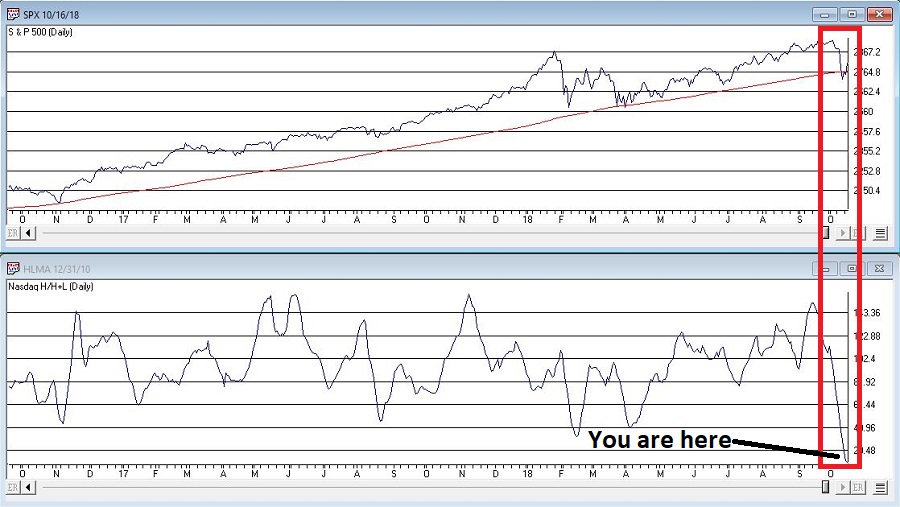
Figure 8: Courtesy AIQ TradingExpert
Summary
The stock market is in a favorable seasonal period and is oversold. As long as the former remains true, react accordingly (with proper risk controls in place of course).
