March was a roller-coaster month for the markets. Sentiment and themes flipped repeatedly, especially with flows dominating the final days of the month as the end of quarter loomed.
The British pound was the top performer of the month, while the Swiss franc and Australian dollar lagged. In the quarter, the Japanese yen led the way, while the Canadian dollar trailed.
Looking ahead, don’t expect a quick return to ‘normal’ markets. Themes tied to geopolitics, trade and inflation-uncertainty won’t be resolved quickly.
Seasonality is one item in the toolbox. Theoretically, markets shouldn’t be affected by seasonals, but the past few years have increasingly proven otherwise, especially when they align with fundamentals and technicals.
Here are some April Q2 seasonals to keep in mind.
USD’s April Blues
April is the worst month on the calendar for the dollar index over the past decade and beyond. USDX declined in April for the past seven consecutive years, and by an average of 1.26% over the last ten years. The weakness is particularly pronounced against the euro and commodity currencies. That theme dovetails with repeated years of economic data weakness in Q1, which are partly related to shifts/additions in equity/bond indices and re-balancing of seasonal-adjustment issues at US statistics agencies. Whatever the reason, April hasn’t been kind to the dollar.
Energy Perks Up
April and May are strong months for oil and natural gas. There is a consistent annual trend of Feb.-May strength in energy that peaks in April, with an average gain of 6.5% over the past decade. It then reverses in the final four months of the year. Similar patterns occur in natural gas with strength from April-June, including 8 consecutive Aprils of gains.
We must remind you that no pattern is infallible, as oil declined 2.5% last April. One spot to watch very carefully is Iran and signals from the Trump administration about leaving the nuclear deal or imposing sanctions.
Loonie Times
Given the seasonal strength in energy, it’s no surprise that April is also the weakest month on the calendar – by far – for USD/CAD. The pair has averaged a 2.45% decline over the past decade including declines in 10 of the past 12 years. This year, it dovetails nicely with a 180-degree turn in the tone of NAFTA negotiations. A self-imposed May 1st deadline has been placed on negotiations and signs of progress will be met with enthusiasm by CAD and MXN.
Stock Market Relief
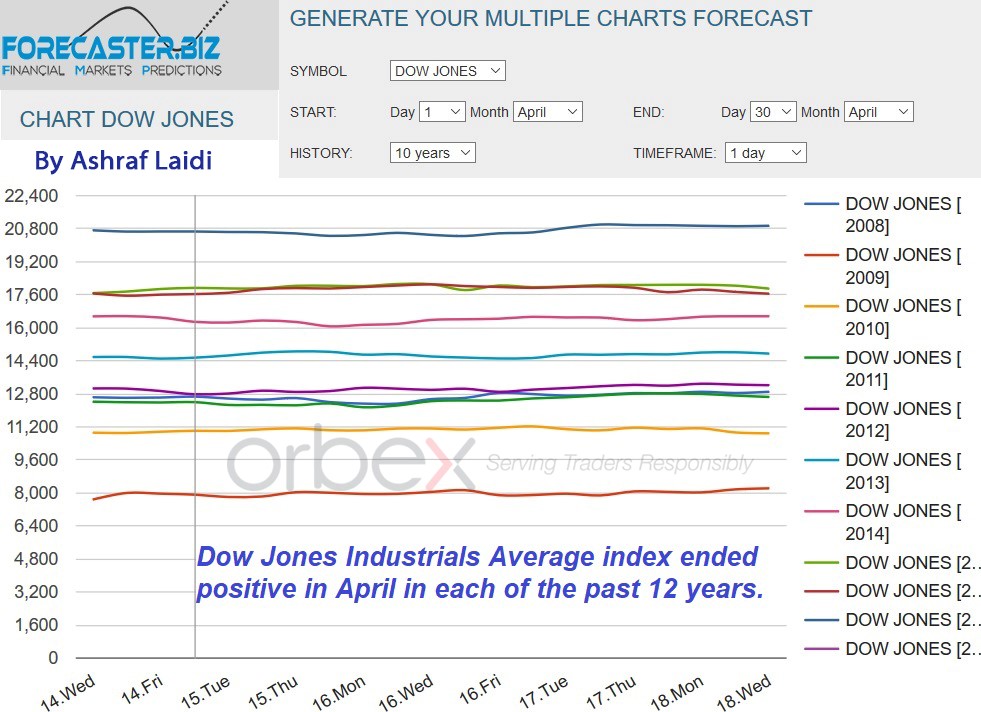
The first 3 weeks of the year started out well for stock markets, before descending into their first quarterly decline in over two years. For the quarter, the S&P 500 finished down 1.2%, the DAX fell 6.3%, FTSE 100 dropped 8.2% and the Nikkei lost 5.8%. At the moment, the S&P 500 is clinging to the 200-day moving average and that will be a key technical metric. With such technical support, there is a decent seasonal argument for accumulating equities. April has proven to be the best or second-best month for virtually every major global equity market.

In the case of the Dow Jones Industrial Average, the index ended higher in each of the last 12 Aprils. This backs the notion of “sell in May and go away,” yet caution must be exercised this Spring with the Q2 seasonals.
