Get 40% Off
🚨 Volatile Markets? Find Hidden Gems for Serious OutperformanceFind Stocks Now

Watch Small Caps For Short-Term Leadership

Published 04/12/2018, 12:32 AM
Updated 07/09/2023, 06:31 AM

The Russell 2000 Index (RUT) is holding closer to its January all-time highs, compared with the Dow 30, S&P 500 and NASDAQ 100 Indices, as shown on the following daily charts.

Its momentum indicator remains the strongest, of late, and is above the zero level, as are the others.
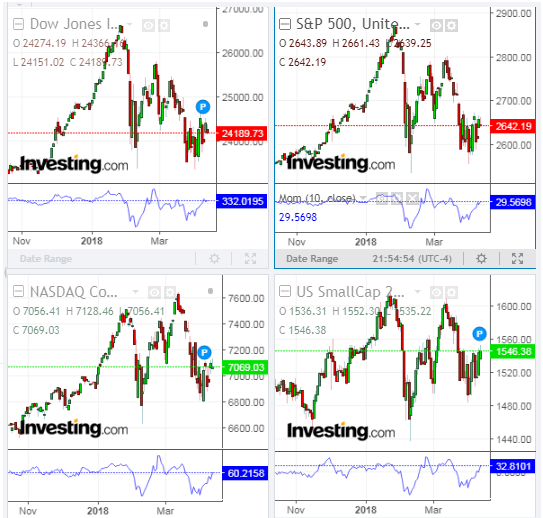
Dow, SPX, COMPQ, RUT Daily

As well, the RUT is showing relative strength in terms of the percentages gained/lost on the following year-to-date and 1-week graphs.

All of this suggests that traders/investors preferred to accumulate risk to value lately.

Keep a close watch on the RUT for leadership on any further strength, or lack thereof, as a potential indicator of whether equities, in general, will either rally towards new highs, or drop to new lows for the year, in the near term.

Dow, SPX, NDX, RUT Losses, January 23-April 11
Dow, SPX, NDX, RUT Performance, Week of April 4-11, 2018

Latest comments

Is this your final statement? Don't later, blame this and that for missed prediction.
As you're no doubt aware, the stock markets are fluid and always fluctuating. A prudent trader remains vigilant in monitoring and adjusting his/her positions in response to changing conditions or factors, whether he/she is a short/medium/long-term trader. To remain firmly unwilling to accept and adapt to those would be financially unwise.
Furthermore, the content in my articles is time-sensitive. You can see the date and time that I originally published each one of them on my personal Blog at Strawberry Blonde's Market Summary (they represent market conditions at that time, as I see them). I have no control over when the editors of Investing re-publish them here on their site. I may sometimes provide an update here and do so as a courtesy to and information for my readers (and is free of charge, as are all my articles)...what they do with that is up to them.
Risk Disclosure: Trading in financial instruments and/or cryptocurrencies involves high risks including the risk of losing some, or all, of your investment amount, and may not be suitable for all investors. Prices of cryptocurrencies are extremely volatile and may be affected by external factors such as financial, regulatory or political events. Trading on margin increases the financial risks.
Before deciding to trade in financial instrument or cryptocurrencies you should be fully informed of the risks and costs associated with trading the financial markets, carefully consider your investment objectives, level of experience, and risk appetite, and seek professional advice where needed.
Fusion Media would like to remind you that the data contained in this website is not necessarily real-time nor accurate. The data and prices on the website are not necessarily provided by any market or exchange, but may be provided by market makers, and so prices may not be accurate and may differ from the actual price at any given market, meaning prices are indicative and not appropriate for trading purposes. Fusion Media and any provider of the data contained in this website will not accept liability for any loss or damage as a result of your trading, or your reliance on the information contained within this website.
It is prohibited to use, store, reproduce, display, modify, transmit or distribute the data contained in this website without the explicit prior written permission of Fusion Media and/or the data provider. All intellectual property rights are reserved by the providers and/or the exchange providing the data contained in this website.
Fusion Media may be compensated by the advertisers that appear on the website, based on your interaction with the advertisements or advertisers.
© 2007-2024 - Fusion Media Limited. All Rights Reserved.