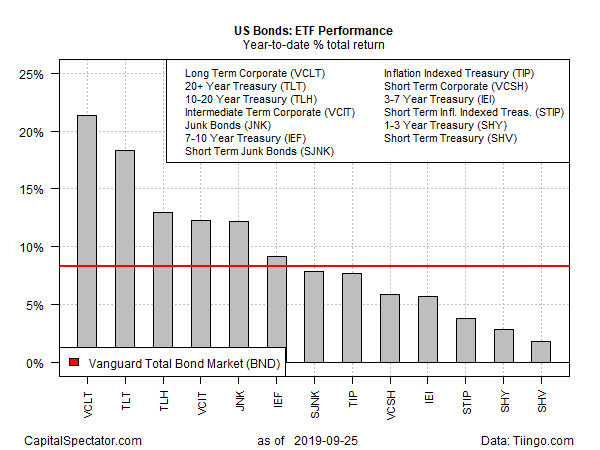
What’s keeping long-dated bonds at the head of this year’s performance ledger for fixed-income markets? Recession worries still top the list, although nervous investors can point to this week’s renewed prospects for impeaching Trump as a factor, too. Whatever the driver, year-to-date returns for bonds continue to show that long maturities are running well ahead of the rest of the field, based on a set of ETFs that span the US fixed-income markets.
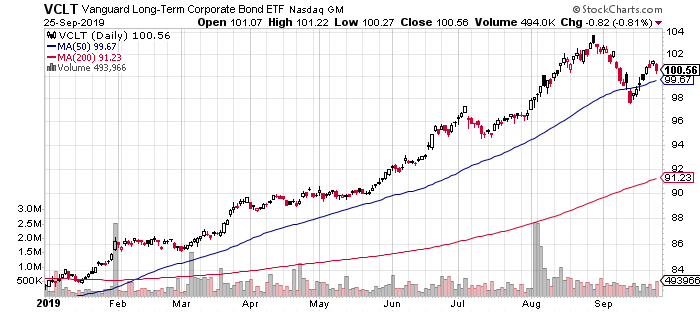
This year’s top performer by a solid margin: Vanguard Long-Term Corporate Bond (VCLT). The fund stumbled earlier this month after a stellar run, but a rebound in recent days has kept VCLT in the lead for year-to-date results. Indeed, the ETF’s 21.4% total return through yesterday’s close (Sep. 25) remains the strongest gain for our set of fund proxies.

A strong runner-up is iShares 20+ Year Treasury Bond (TLT), which is up 18.4% in 2019. Echoing VCLT’s trading history of late, TLT weakened in early September but has clawed back some of the losses lately.

Although long bonds continue to outperform this year, investors are wondering if the rally has gone too far too fast. In a sign of the times, yesterday’s comment on trade by President Trump was a factor that cut prices and raised yields. A China trade deal could happen “sooner than you think,” Trump said – a remark that was widely seen as a catalyst in the bond market’s retreat on Wednesday.
Adding to the cloudy outlook for bonds is a mixed view on the outlook for next month’s monetary policy decision. The probability is roughly 53% that the Federal Reserve will cut interest rates again at next month’s policy meeting, based on Fed funds futures.
But bond bulls counter that economic threats continue to lurk. The latest forecast that sees trouble ahead comes from the United Nations’ trade and development body, Unctad, which advises that headwinds are rising, driven by expectations that trade activity will continue to slow.
“A spluttering north, a general slowdown in the south and rising levels of debt everywhere are hanging over the global economy,” the Unctad explains. “These combined with increased market volatility, a fractured multilateral system and mounting uncertainty, are framing the immediate policy challenge.”

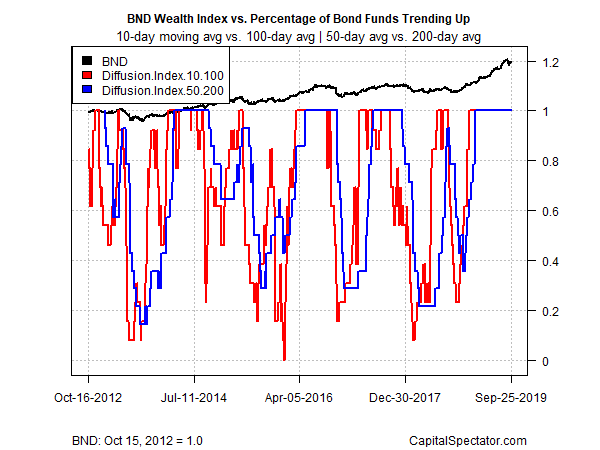
In any case, bullish momentum remains strong and widespread in the fixed-income realm, based on a profile of price trends for the funds listed above. The first metric compares each ETF’s 10-day moving average with the 100-day average — short-term trending behavior (red line in chart below). A second set of moving averages (50 and 200 days) offers an intermediate measure of the trend (blue line). The indexes range from 0 (all funds trending down) to 1.0 (all funds trending up). Based on prices through yesterday’s close shows that all the bond ETFs cited remain in a strong bullish posture.
