T2108 Status: 45.5%
T2107 Status: 69.7%
VIX Status: 13.3
General (Short-term) Trading Call: neutral
Active T2108 periods: Day #149 over 20%, Day #5 over 30%, Day #1 over 40% (overperiod, ending 6 days under 40%), Day #9 under 50% (underperiod), Day #9 under 60%, Day #37 under 70%
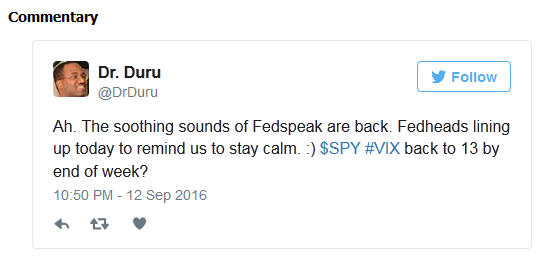
I tweeted that comment after volatility beat a hasty retreat from its massive and historic spike after Boston Fed President Eric Rosengren spooked the stock market. The volatility index, the VIX, actually never closed lower than that day’s close…until the Federal Reserve delivered its September pronouncement on monetary policy.
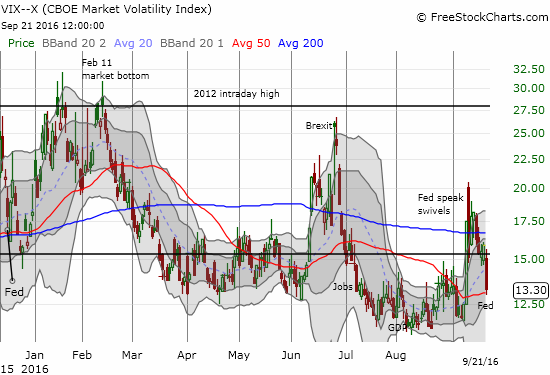
A particularly strong post-Fed fade of volatility. The VIX returns right back to the previous consolidation zone.
As I noted in my last T2108 Update, I was primed to fade volatility ahead of the Fed announcement. As the chart above shows, the Fed delivered once again and with flare.
The volatility index, the VIX, plunged 16.5%. I had to adjust my strategy as the market began its celebrations early with a strong open. I next assumed the market would not deliver a last minute spike in volatility ahead of the Fed.
So, I rushed to load up on ProShares Ultra VIX Short-Term Futures (NYSE:UVXY) put options and placed a sell to open order on a call option against UVXY shares in case a spike came after all. The call option never triggered although UVXY managed to briefly return to the previous day’s close just ahead of the Fed announcement. My put options sold near the close with a 153% return.
At 13.3, the VIX now sits close to its level ahead of Rosen-aggedon. The plunge sent ProShares Ultra VIX Short-Term Futures (UVXY) to a 15.5% loss and close to another all-time low (familiar territory for this asset that fights a losing battle with decay).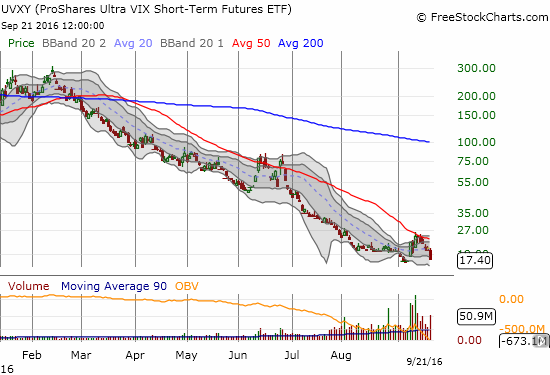
ProShares Ultra VIX Short-Term Futures (UVXY) has had a particularly rough year – near constant, persistent declines.
The post-Fed volatility fade is an amazingly consistent trade. In this month’s edition, I think there was lingering fear of a Fed surprise. While the odds for a September hike were very small, the damage (a rapid plunge in stock prices) from such a surprise would have been very high.
Clearly, there are plenty of market participants who are not yet convinced that the Fed will NOT hike rates when the Fed fund futures have not priced it in. Going into the Fed meeting, the futures voted solidly for December as the timing for the next hike. Even after Fed Chair Janet Yellen explicitly called for one rate hike this year based on the majority from the Fed, the futures left the odds for the December hike essentially the same.
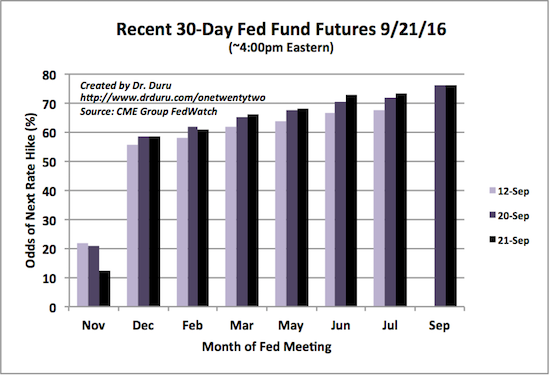
The September Fed decision barely caused a wrinkle in prior rate expectations. (September 12th is the Monday when several FedHeads spoke in contrast to Rosengren’s extremely hawkish speech on Friday, September 9).
Source: CME FedWatch Tool
Three months is a LONG time and a LOT can still happen to scare the Fed all over again. The U.S. Presidential election in November sticks out as the largest potential catalyst for a hasty Fed retreat. So, I will be holding onto shares of UVXY at least through the end of September and perhaps into October earnings season. I plan to play volatility around the election but will wait until the time approaches to devise a trading strategy.
My short-term trading call remains neutral although the tidings are definitely blowing the way of the bulls. The S&P 500 (SPDR S&P 500 (NYSE:SPY)) gained 1.1% but still closed below 50DMA resistance.
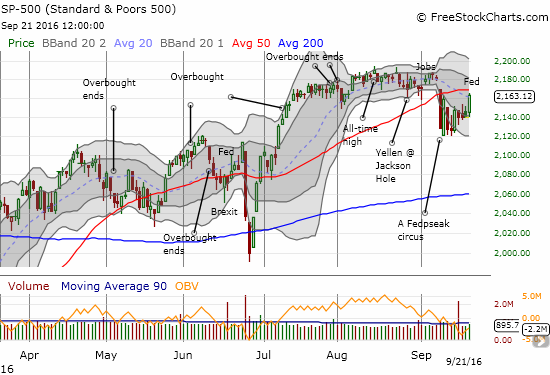
The S&P 500 lurches toward 50DMA resistance again.
T2108, the percentage of stocks trading above their respective 40DMAs, sits firmly in the corner of the bulls. The post-Fed celebration sent T2108 surging from 32.8% to 45.5%. This move marks an end to the “close encounter” with oversold trading conditions. Compare the current period to the recovery from Brexit in late June.
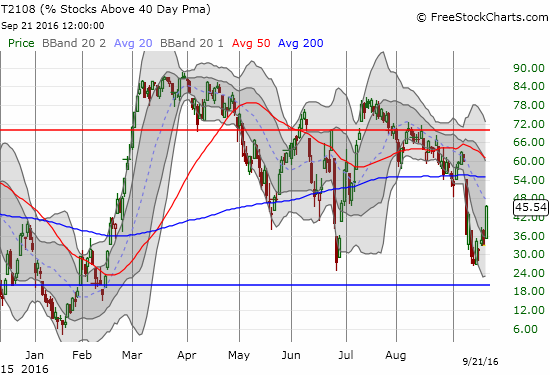
T2108 celebrates the end of another Fed meeting with a tremendous surge away from the recent tease with oversold conditions.
The NASDAQ (via PowerShares QQQ Trust Series 1 (NASDAQ:QQQ)) is the most impressive win for the bulls. The tech-laden index gained 1.0% gain and printed a fresh all-time high.
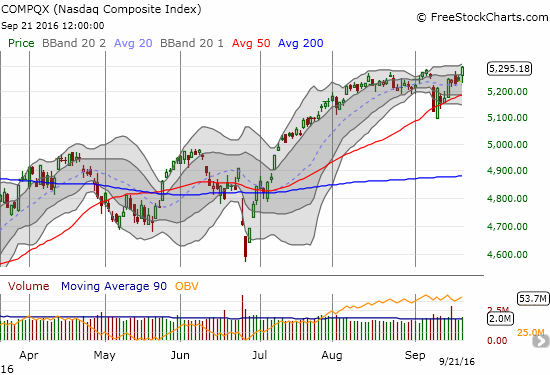
The NASDAQ (QQQ) liked what the Fed had to say.
All this celebrating suggests that the market is already getting comfortable with the notion of an imminent rate hike in December. A more cynical view, and perhaps more accurate one, is that the market believes the Fed’s posturing confirms that it can easily be dissuaded from the plan for one rate hike this year.
Since the Fed first suggested a rate hike cycle had to begin, it has demonstrated extreme reluctance. The latest display of reluctance comes in this statement where the Fed noted that the economy has strengthened enough for a rate hike, BUT… (emphasis mine)
“…the recent pickup in economic growth and continued progress in the labor market have strengthened the case for an increase in the federal funds rate. Moreover, the Committee judges the risks to the outlook to be roughly balanced. So why didn’t we raise the federal funds rate at today’s meeting? Our decision does not reflect a lack of confidence in the economy. Conditions in the labor market are strengthening, and we expect that to continue. And while inflation remains low, we expect it to rise to our 2 percent objective over time. But with labor market slack being taken up at a somewhat slower pace than in previous years, scope for some further improvement in the labor market remaining, and inflation continuing to run below our 2 percent target, we chose to wait for further evidence of continued progress toward our objectives. This cautious approach to paring back monetary policy support is all the more appropriate given that short-term interest rates are still near zero, which means that we can more effectively respond to surprisingly strong inflation pressures in the future by raising rates than to a weakening labor market and falling inflation by cutting rates.”
In other words…the economy is practically reaching the trigger point in asymptotic fashion: it is getting ever so close but-still-not-quite-there-yet. As a result, the Fed is much more afraid of hurtling the economy into recession than drowning it under inflationary pressures. So you can bet the Fed will NOT spring a surprise rate hike on the market.
Since this day was a rally day, stocks were strong in almost every corner. I still have some special call-outs.
First of all, commodities were strong from the open. Gold and silver traders could no longer hold back their eagerness to fade the Fed. Both SPDR Gold Shares (NYSE:GLD) and iShares Silver Trust (NYSE:SLV) gapped up.
GLD closed at its 50DMA resistance. SLV broke out from resistance and looks prepared to lead the way. Perhaps my fresh sympathy for gold and silver did not mark an end to the run-up after all.
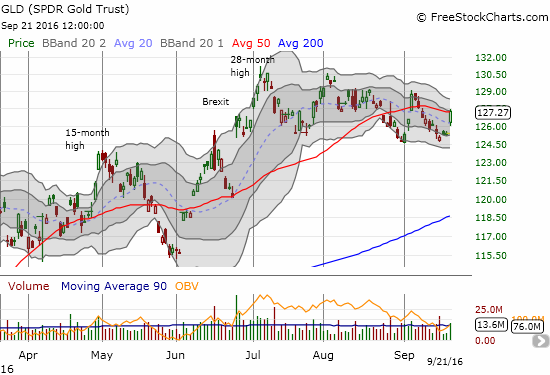
SPDR Gold Shares (GLD) gapped up but still needs to leave 50DMA resistance behind.
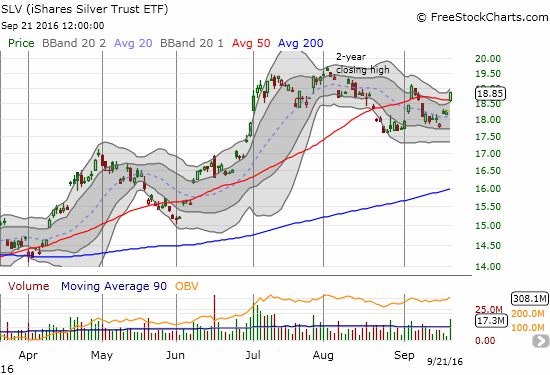
iShares Silver Trust (SLV) broke out again. Can this time hold?
In parallel, the U.S. dollar index (DXY0) faded from 200DMA resistance. Yet, the dollar is also clinging to support from an uptrending 20DMA. Its fight may yet continue.
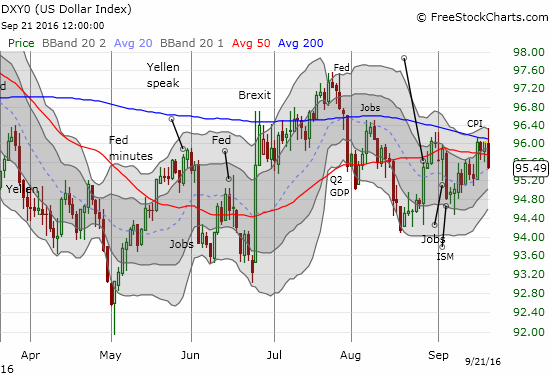
The U.S. dollar index looks like it is forming a wedge-like pattern under 200DMA resistance.
China-related stocks were also very strong on the day. For example, Baidu Inc (NASDAQ:BIDU) shot out the gate and by the time the Fed was done, the stock grabbed a nice 5.2% gain and a new 9-month closing high. This move invalidated the previous topping pattern. BIDU is also up 14.6% since gapping down on a downgrade from JP Morgan…ouch.
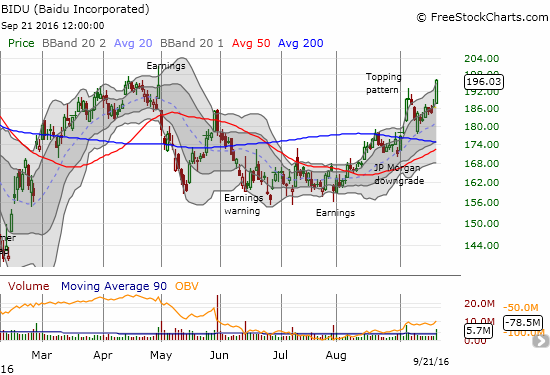
Baidu (BIDU) rocketed higher in celebration of the Fed.
The iShares MSCI Emerging Markets (NYSE:EEM) looked so good post-Fed, I rushed in for a large speculative position of call options expiring this Friday. This is an unusual move for me as I typically prefer to make hedged plays on EEM that are spaced out two weeks to a month out.
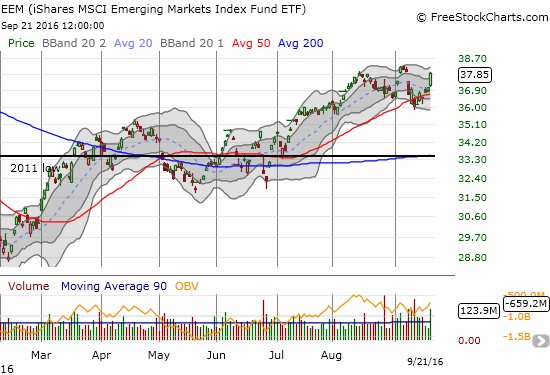
The iShares MSCI Emerging Markets (EEM) rocketed higher for a 2.8% gain. A new high looks near inevitable.
Netflix (NASDAQ:NFLX) once again proved the value of my 2-week hedged strategy. The stock delivered with a gap down from 200DMA resistance that took the stock down as far as a 5% loss. Apparently NFLX said something during the Goldman Sachs Cornucopia Conference that made traders forget all about the pre and post-Fed celebrating on the day. I sold my put options near the lows. With NFLX closed precariously at 50DMA resistance, I am considering reloading on put options depending on the tone from the rest of the market.
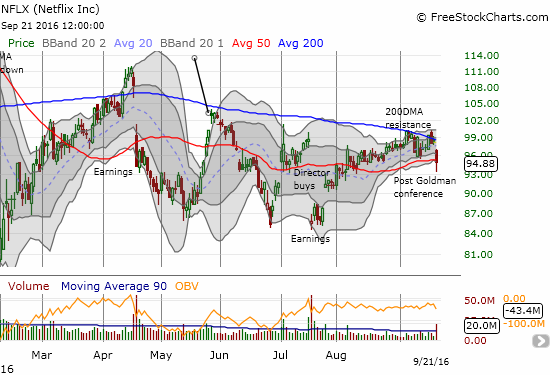
Netflix broke down after presenting at the Goldman Sachs (NYSE:GS) Cornucopia Conference the previous evening.
Apple (NASDAQ:AAPL) barely closed flat thanks to the extra boost from the Fed. Otherwise, the stock would have confirmed the current topping pattern. My position last week to buy put options on AAPL was correct, but I may run out of time to profit much from them.
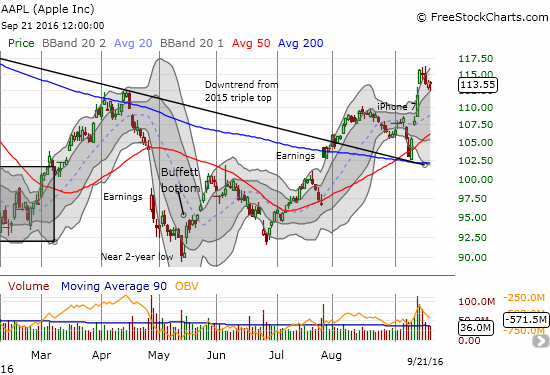
The newfound momentum in Apple (AAPL) has ended as quickly as it reappeared. Who will win the current stalemate?
Finally, FedEx Corporation (NYSE:FDX) delivered a post-earnings home run. Its breakout from a range in lace since March is about as bullish as it gets. The bears are clearly running out of gas and running out of time…the danger season for the stock market ends in a little more than a month…
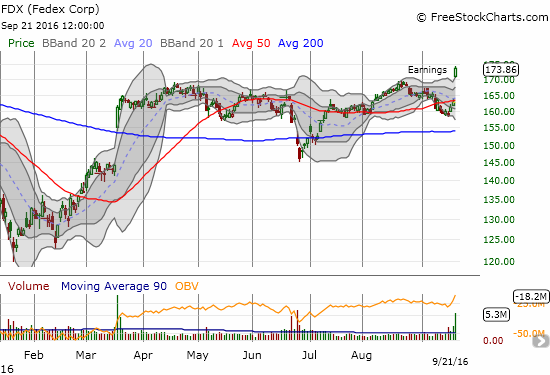
A bullish breakout for Federal Express (FDX) sent the stock gapping up into a 15-month high.
Daily T2108 vs the S&P 500
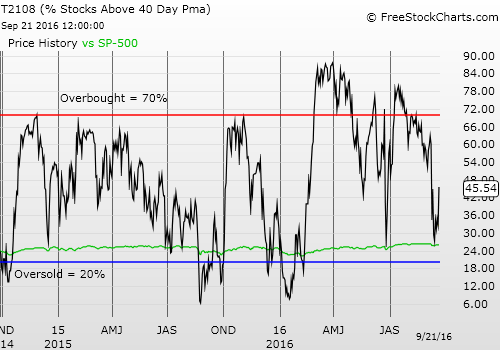
Black line: T2108 (measured on the right); Green line: S&P 500 (for comparative purposes)
Red line: T2108 Overbought (70%); Blue line: T2108 Oversold (20%)
Weekly T2108
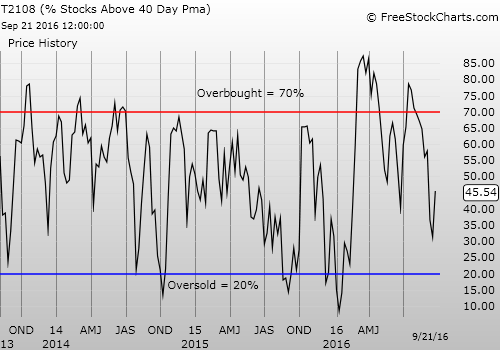
The charts above are the my LATEST updates independent of the date of this given T2108 post.
Full disclosure: long SDS, long UVXY shares, long AAPL puts, long GLD, long SLV shares and call options, long NFLX call options
