This week should see a lot of volatility, now that we are past options expiration and gamma has rolled off. It means we should expect to see big swings in the market as gamma levels get rebuilt over the next couple of weeks.
Bitcoin
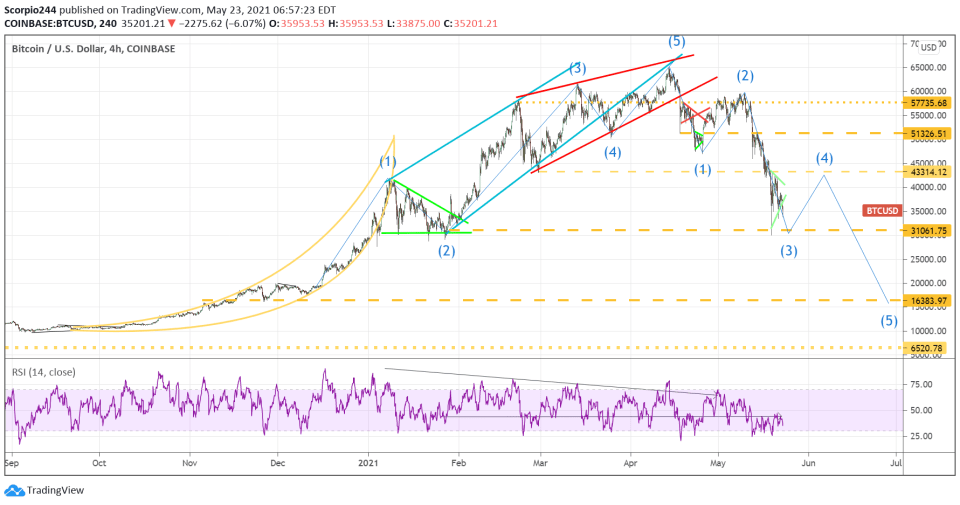
However, the outlook this week looks more negative than positive given the volatility in Bitcoin this weekend. The cryptocurrency continues to melt, and I don’t see that situation improving any time soon. If bitcoin is a bubble, which I believe it is, then you are likely to see it settle back around 16,000 at some point.
Bitcoin continues to melt, and I see no end in sight for the decline. I think we are likely to retest the lows around 29,000, and maybe lower. The crypto is in a consolidation pattern currently and is getting ready for another drop. The decline looks too impulsive to be part of a retracement pattern. Therefore, we could be in a 5 wave count lower; it suggests it falls back to around 16,000.
There are many problems with it; the most obvious is that I can’t imagine that Bitcoin ever becomes a global currency or any of these crypto’s do. It seems highly unlikely that any country would endorse the use of any crypto. It would mean that that country would lose the ability to control its own currency, which means it would not have the ability to issue its own debt.
It is likely why China is now beginning to crack down on the concept of mining for Bitcoin and why other countries will likely follow. It is why China is developing its own digital yuan. Do I think a digital currency is the way of the future? Yes, but in a country’s own currency.
In a way, we already have digital dollars; we have had it for decades. Every time you swipe your credit card or debit card, it is a digital transaction. Every time you transfer money via Venmo or Cash App, you are making a digital transaction. It is transmitted in dollars electronically via a network.
Anyway…
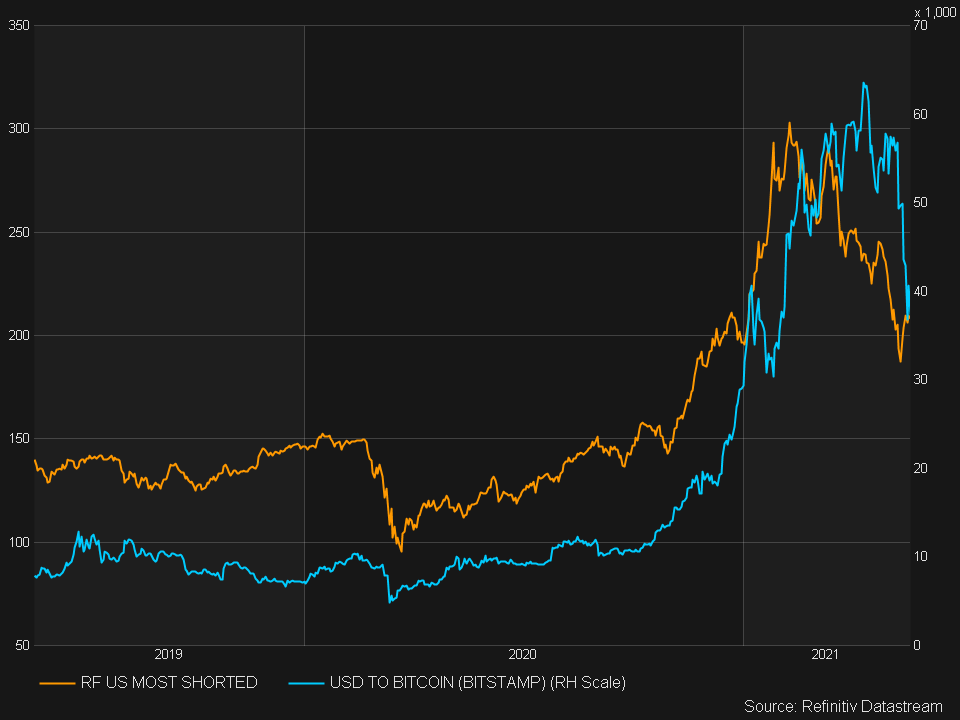
For those that think Bitcoin is not correlated to stocks or a sentiment indicator, think again. Just look at the decline in the Refinitiv most shorted stocks over the last few months and look at the decline in bitcoin price. There is something there. Global market sentiment is shifting.
Taiwan
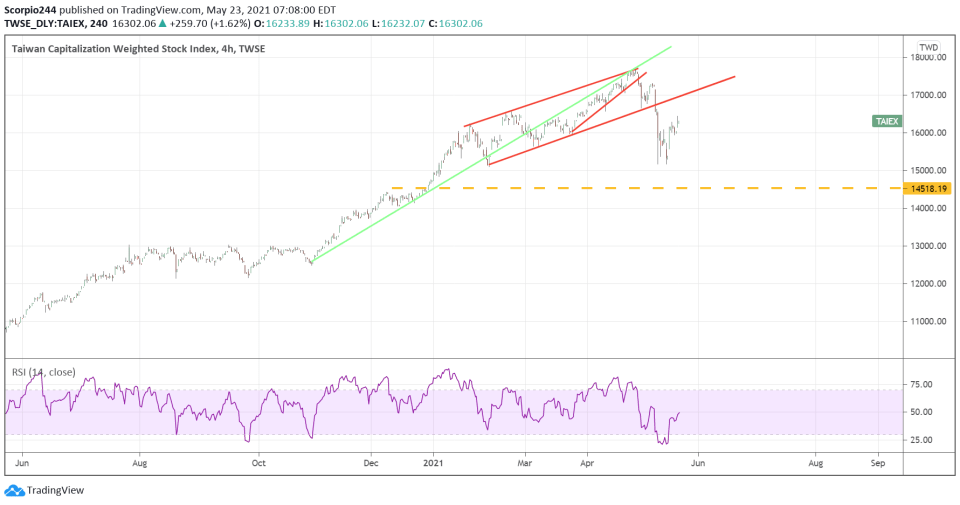
Taiwan Semiconductor (NYSE:TSM) has seen a very sharp drawdown recently, breaking a huge uptrend.
NASDAQ
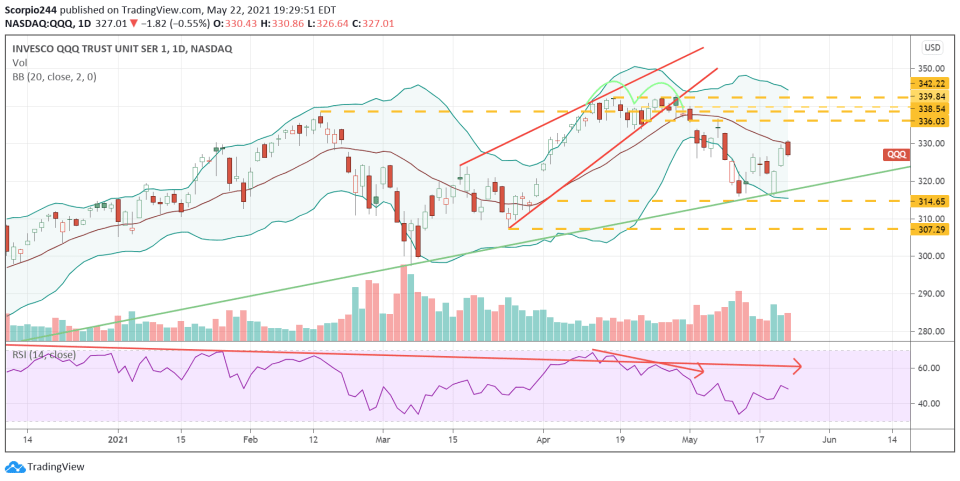
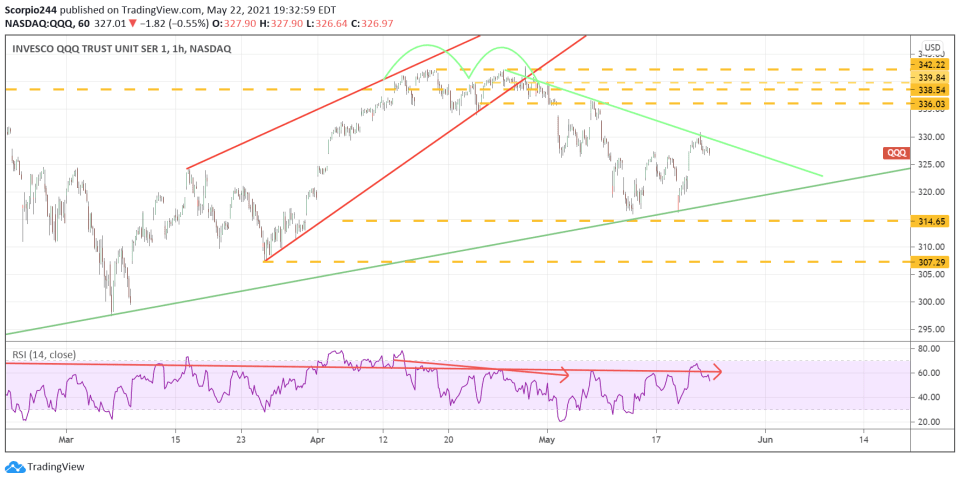
The NASDAQ 100 (QQQ) finished last week higher by less than 20 bps, but it was the first time in 4 weeks that the ETF was up. The ETF got as high as the 20-day moving average on Friday, and that is where it failed. The ETF isn’t oversold anymore either, which would suggest lower prices lie ahead for the ETF and the broader market when coupled with a declining relative strength index, and weakening market sentiment.
I’m looking for a retest of that uptrend line at $320.
Russell 2000
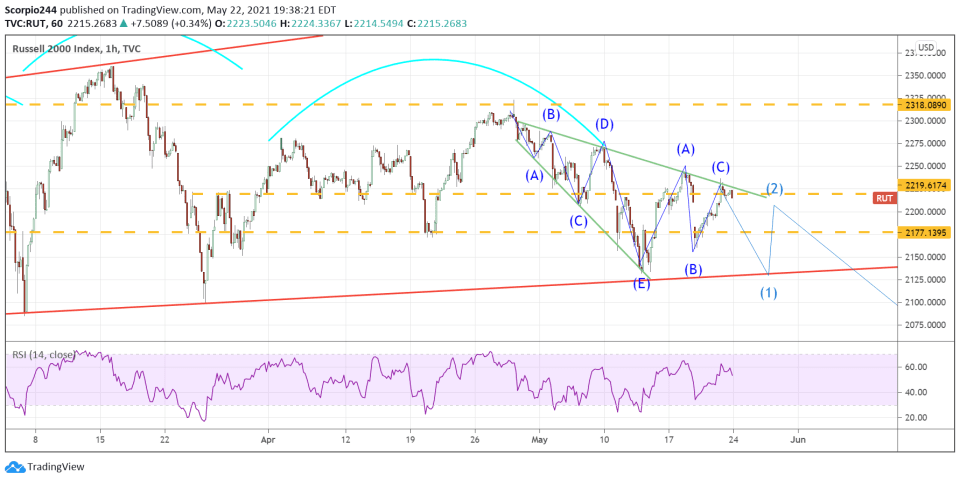
The IWM rose to the top of the broadening wedge on Friday and failed to push higher. I view this as a big negative. This means there is a chance we have a drawdown to support at 2,125.
Thomson Reuters CRB Index
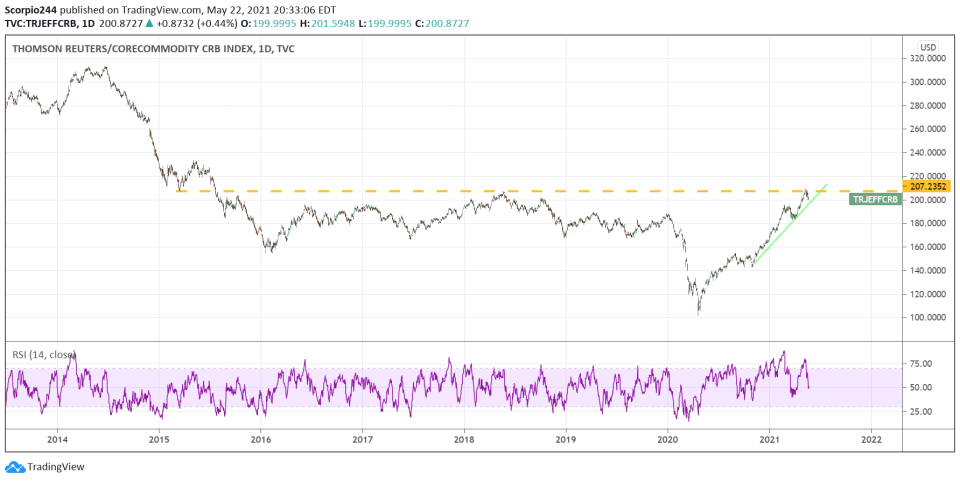
It isn’t just Bitcoin, the most shorted stocks, or equity markets struggling. The commodity Thomson Reuters CRB Index is stalling out at key resistance levels around 208. This seems to tell a tale of an overall marketplace that may be tiring and running on fumes. If commodity prices start to roll over, that very well could kill our reflation story, and that would be a big issue for stock prices going forward.
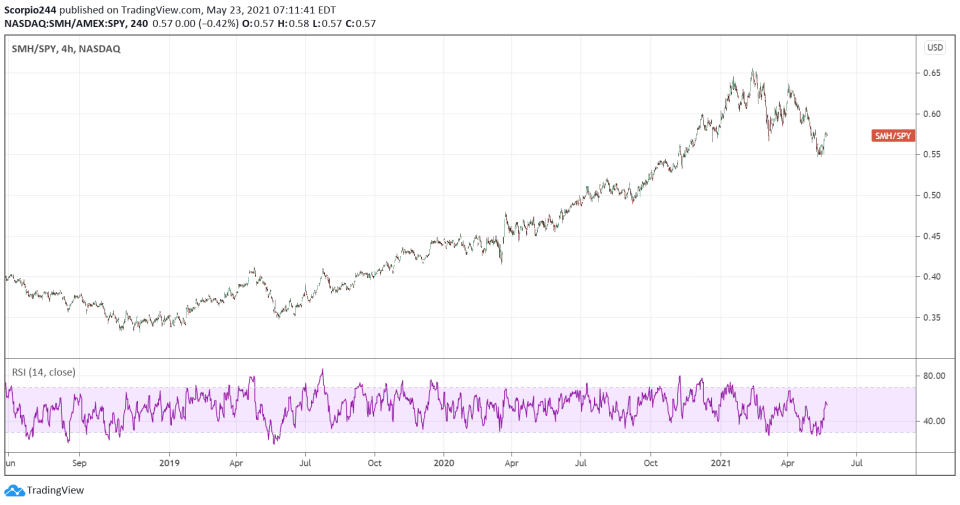
Just look at the breakdown in the SMH semiconductor ETF relative to the S&P 500 (SPY)
BHP
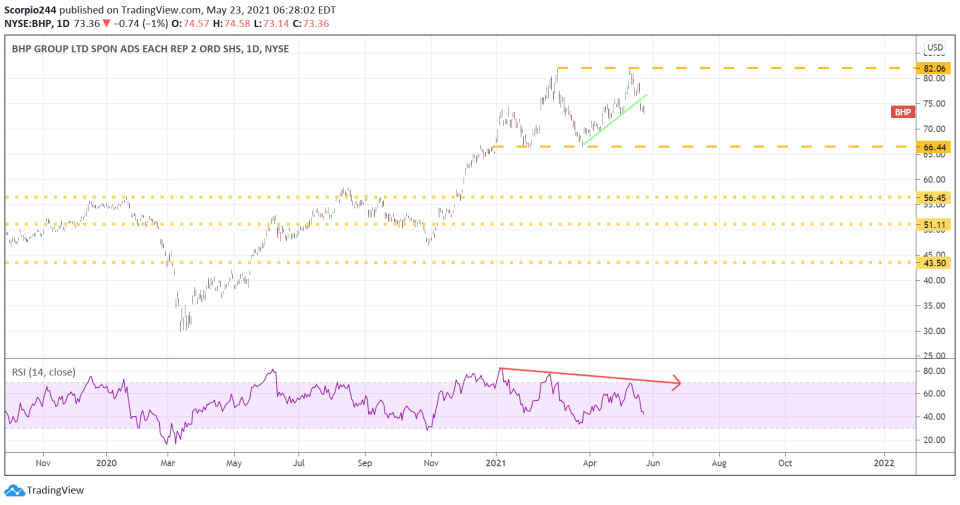
Meanwhile, the run-up in some of these materials and mining stocks may be near their ends as well. BHP (NYSE:BHP) has broken an uptrend and appears to have formed a double top pattern. We will still need confirmation of this pattern’s breakdown, but a drop below $66.40 will likely lead to something steeper, perhaps back to $56.50. The RSI is pointing lower, confirming the bearish setup.
Freeport
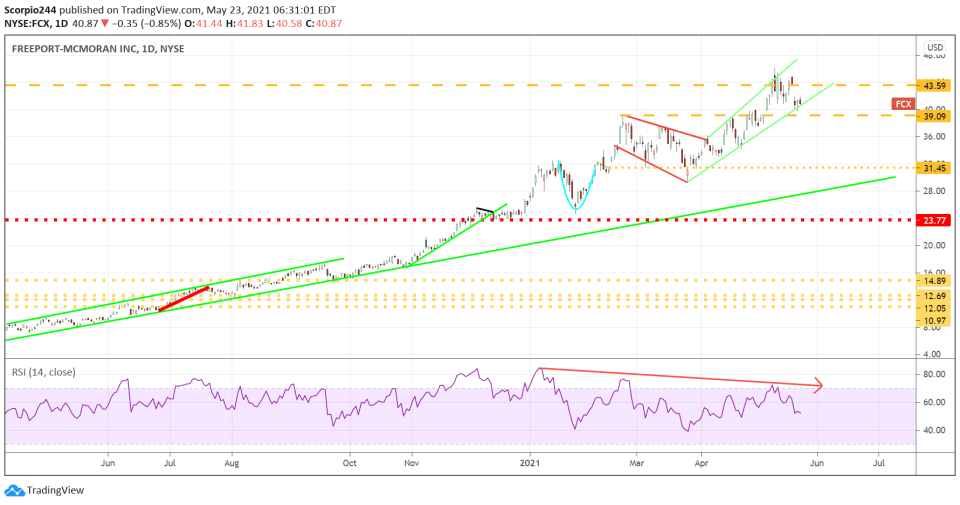
Freeport-McMoran (NYSE:FCX) doesn’t have a double top pattern, but it is very close to breaking an uptrend and has a downtrend in its RSI as well, suggesting that lower prices, potentially to as low as $31.50.
Union Pacific
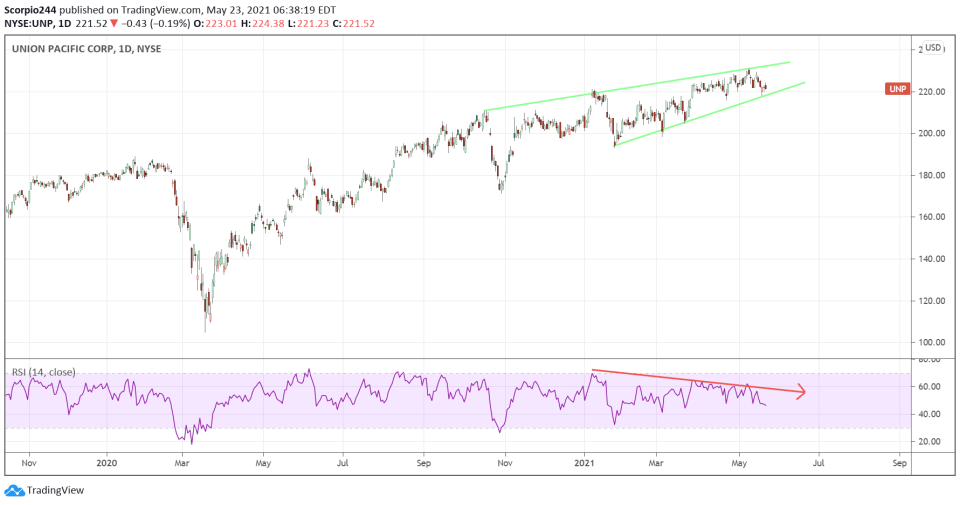
Union Pacific (NYSE:UNP) has had a big run-up too, but this one appears to be forming a rising wedge pattern, likely marking the end of the big run-up in the shares. The RSI is dropping as well.
GE
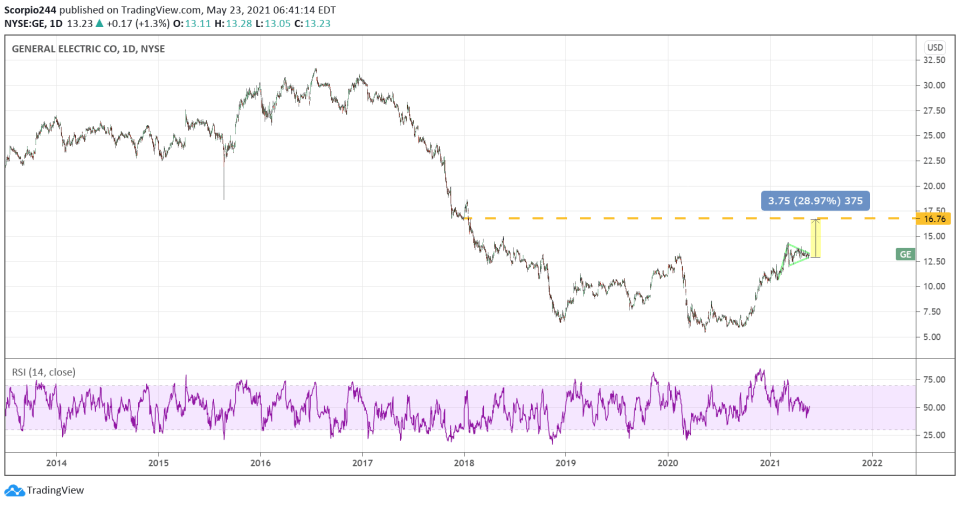
General Electric (NYSE:GE) looks pretty good; there appears to be a pennant pattern forming, which in this case appears to be bullish. It could even go to as high as $16.75 if it can manage a breakout.

