Stocks finished the day yesterday basically flat, with the S&P 500 down 16 bps, at 3962, the very upper end of my so-called range of the index.
The VIX finished the day at 20, the so-call bottom of my range. I have been pretty stubborn about the VIX and the SPX, saying on several occasions, the area between 20 and 22 in the bottom of the range for the VIX and that 3950 to 3960 is the upper end of the range for the SPX.
Most of this hinges on the VIX because if the VIX breaks down, then the S&P 500 is sure to break higher. If the VIX doesn’t break down and instead rises, the S&P 500 is sure to fall.
The whole concept of 20-22 on the VIX being the low end of the range is something I came up with a “few” months ago. I based it on the elevated call volume trading in the market, lifting implied volatility levels. But more recently, we have started to see options volume fall. That has led to implied volatility dropping more recently.
Call volume is very elevated historically and well ahead of pre-pandemic levels, but it has fallen, especially since the NASDAQ and technology sectors have witnessed a steep decline.
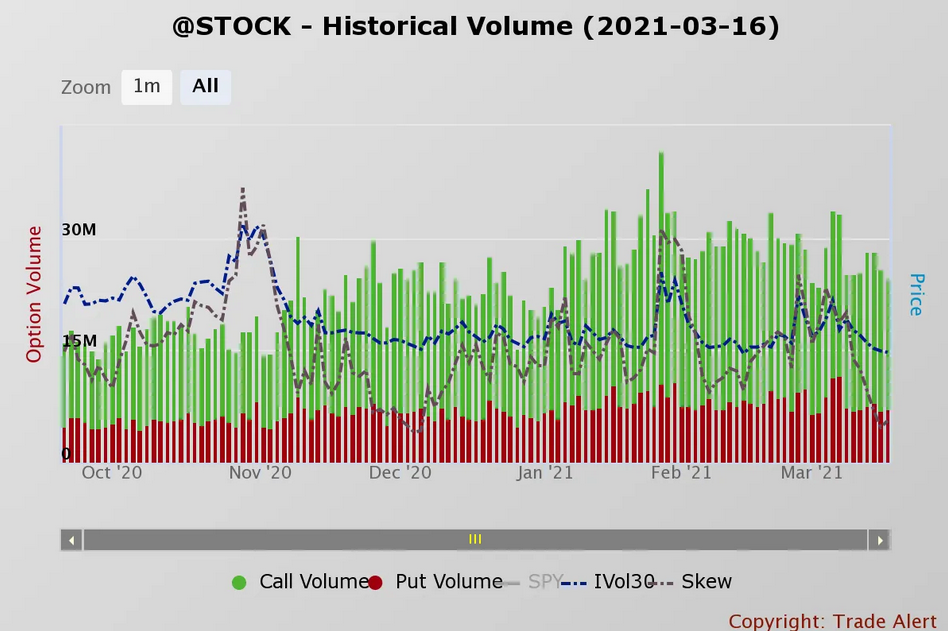
That said, I think the 20 levels on the VIX will hold as the bottom of the range, and that will keep the SPX from moving much beyond the upper end of my range at 3960.
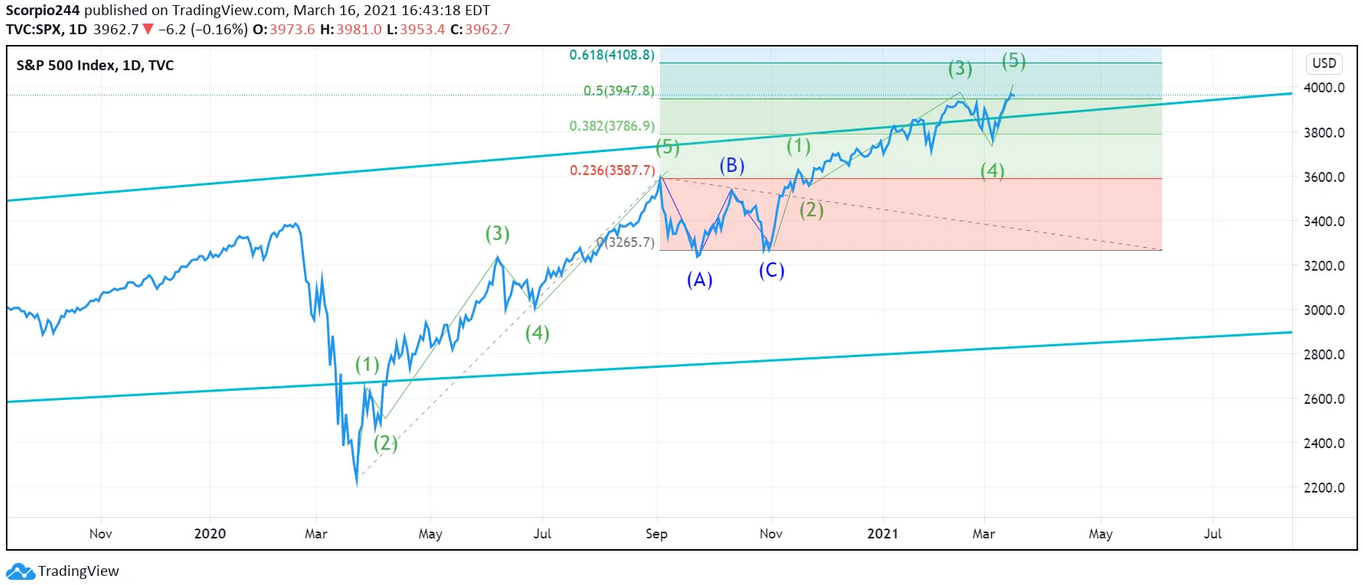
The 3950 to 3960 zone has been a tough level for the S&P 500 for some time, going back to the middle of February. Using a Fibonacci extension, this area in the S&P 500 is the 50% level from March lows to September highs.
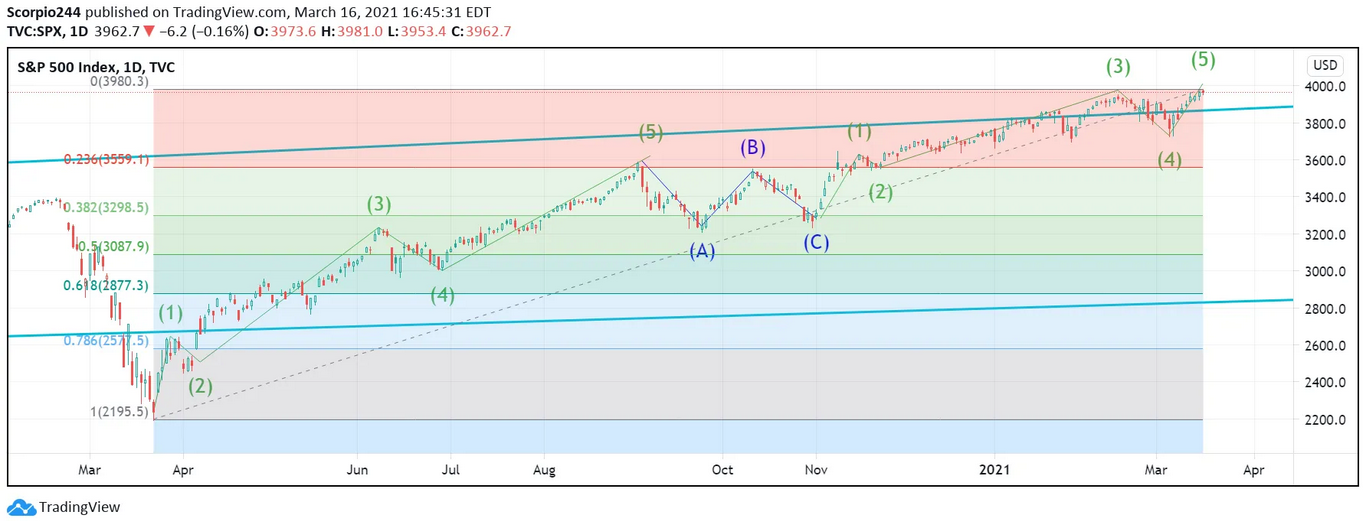
This region also matches up well with a Fibonacci retracement of 38.2% off the March low placing the S&P 500 at the gap at 3300, and the 61.8% retracement lining up with the gap around 2870.
Of course, all of this could quickly change today, after the Fed announcement at 2 PM. All eyes will be on those dot plots. I doubt that that Fed changes much of anything anywhere. One dot in the wrong place could send the wrong message to some market. The bottom line, I don’t see how the Fed will please both the bond market and the equity market today.
Suppose the Fed moves the dots to reflect higher rates sooner, then equities will likely sell-off. If the Fed does nothing, then it is likely the bond market that sells-off. I don’t see a scenario in the status quo.
The one scenario that is likely the worst case, which I think the Fed will choose, is doing nothing. Leave everything as close to the same as possible.
Of course, this will send bond yields and the equity market, not the sharpest tool in the shed, higher initially. That is until stocks realize the bond market is unhappy and sees the dollar moving higher as a result. This will cause the risk-off event, I have feared. I could easily be wrong, but I have to make a call; otherwise, what good am I.
Even though the NASDAQ 100 was higher, it was not a good day for technology names. The big names that have really helped drive things higher got hit hard, with Tesla (NASDAQ:TSLA), Zoom Video (NASDAQ:ZM), Peloton (NASDAQ:PTON), and DocuSign (NASDAQ:DOCU) all down by more than 4%.
Zoom Video
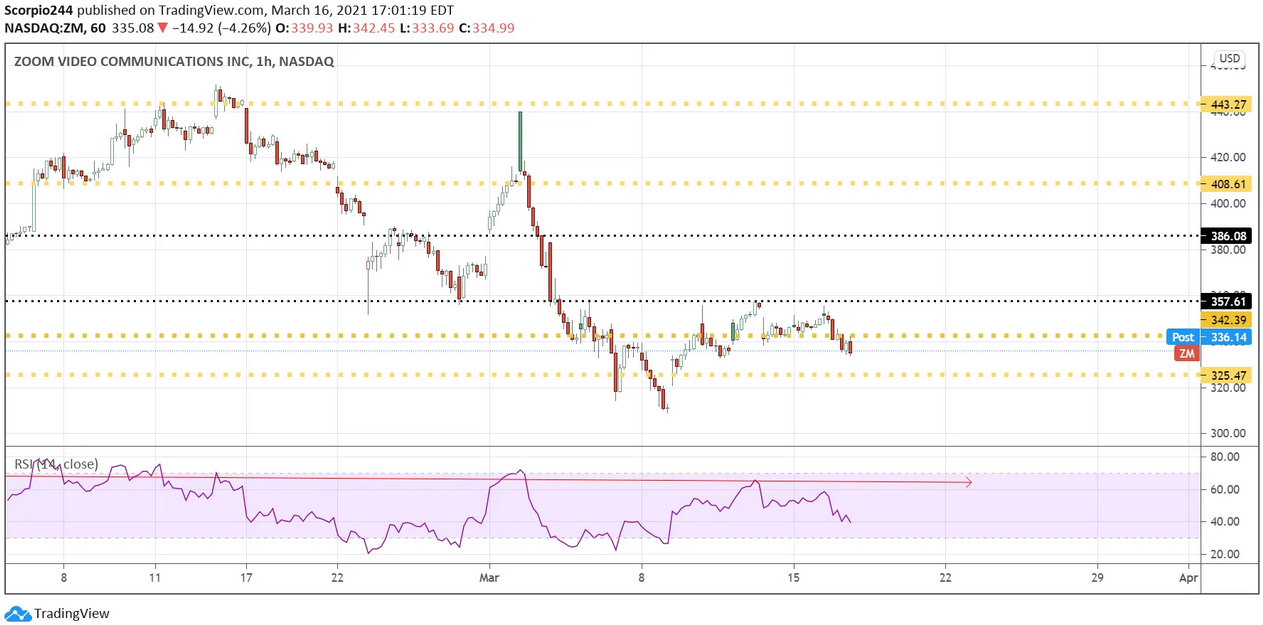
Zoom Video (ZM) has been trying to get over resistance at $357 and can’t. It finally gave in Tuesday, closing below support $342. It will likely set-up a retest of the $325 level.
DocuSign
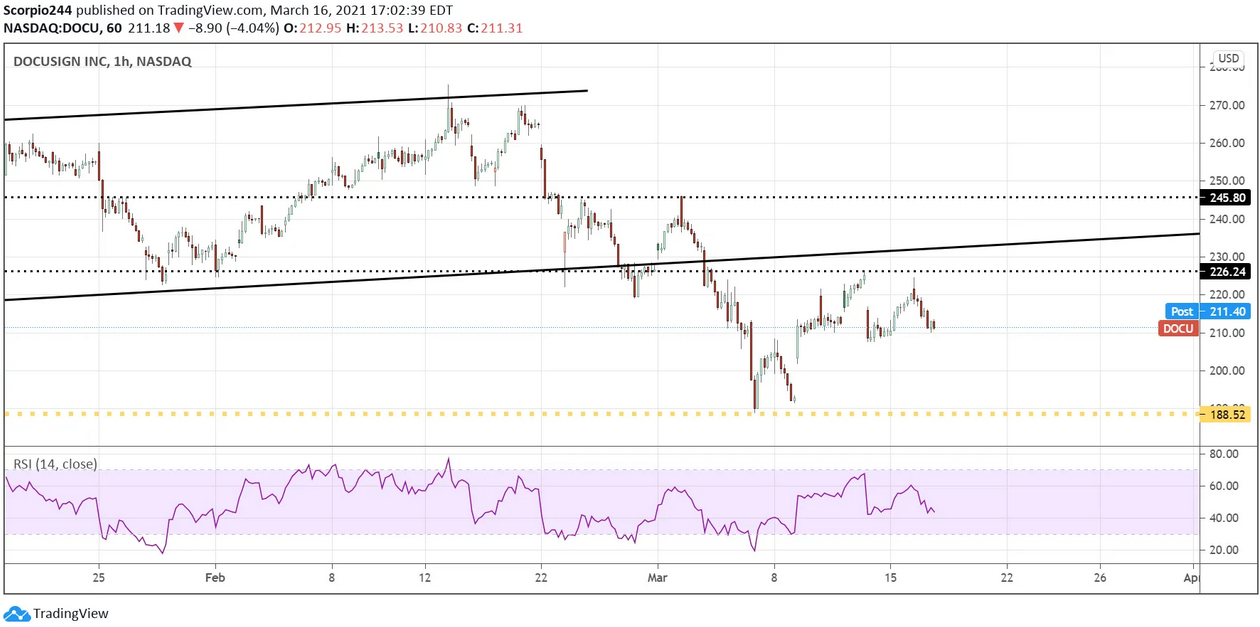
DocuSign (DOCU) managed to rise all the way back to resistance at $226 and close the gap. Now it has to go and fill the gap at $188.50.
Alibaba
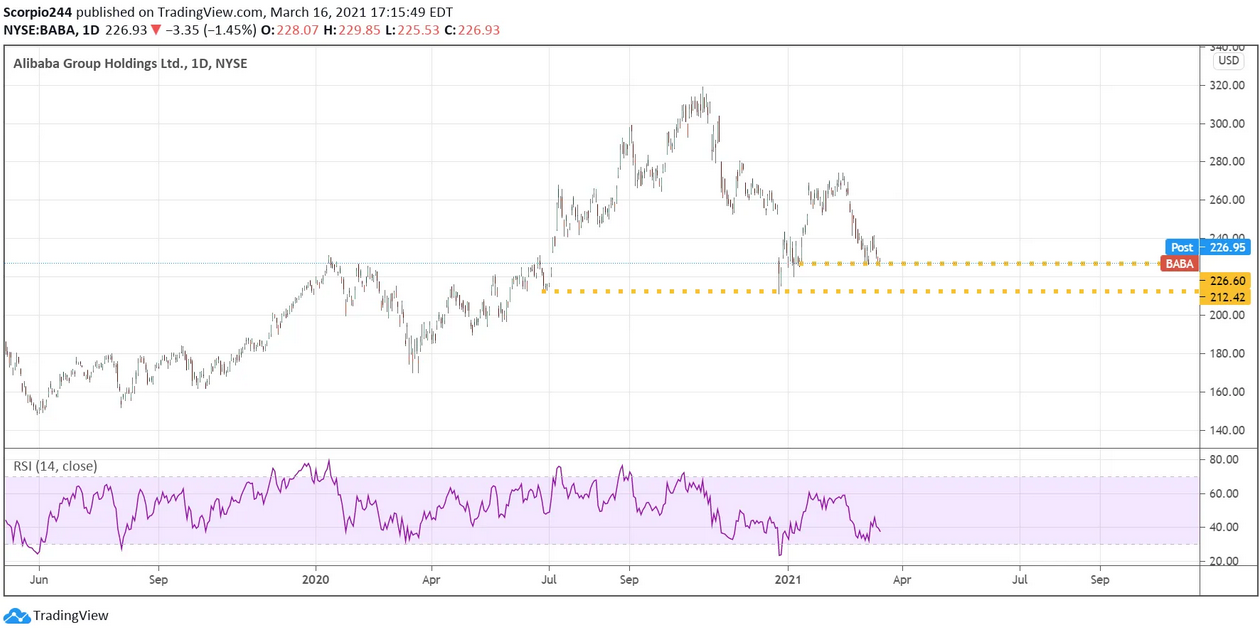
Alibaba (NYSE:BABA) continues to look really weak here and seems to be getting ready to drop to around $212.
Apple
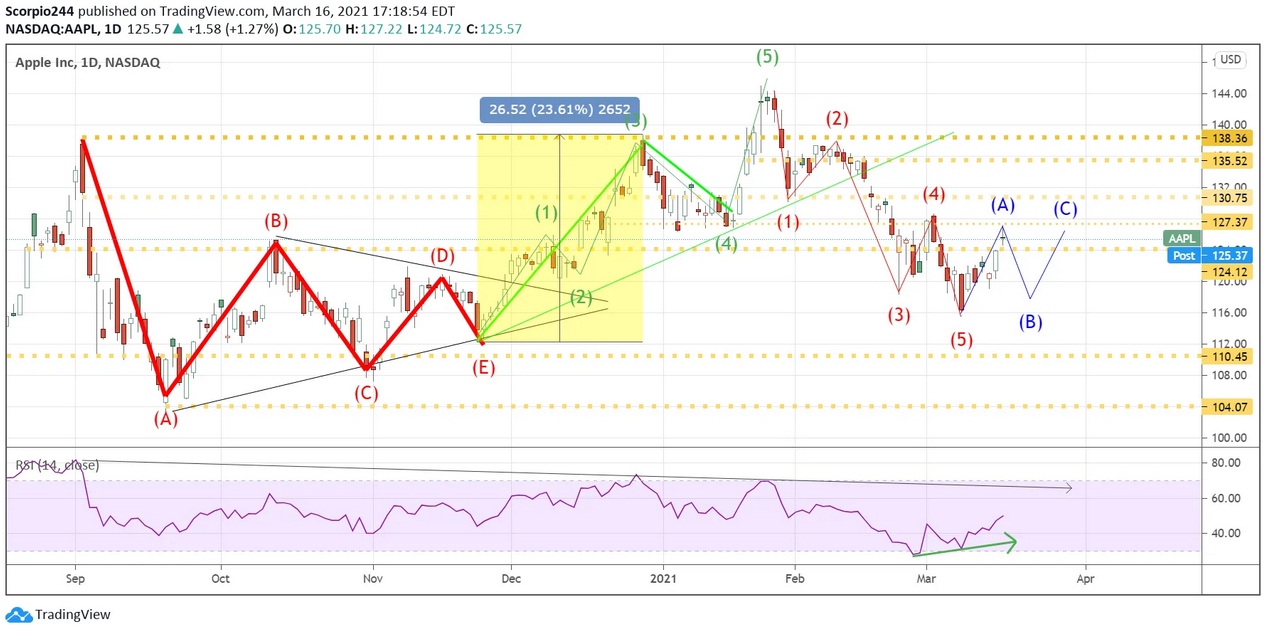
Apple (NASDAQ:AAPL) got to resistance at $127 and failed to advance. The stock doesn’t look healthy there. The patterns would suggest the move lower isn’t over, and the problem is that the trend in the RSI would suggest that the move lower isn’t over either.
Amazon
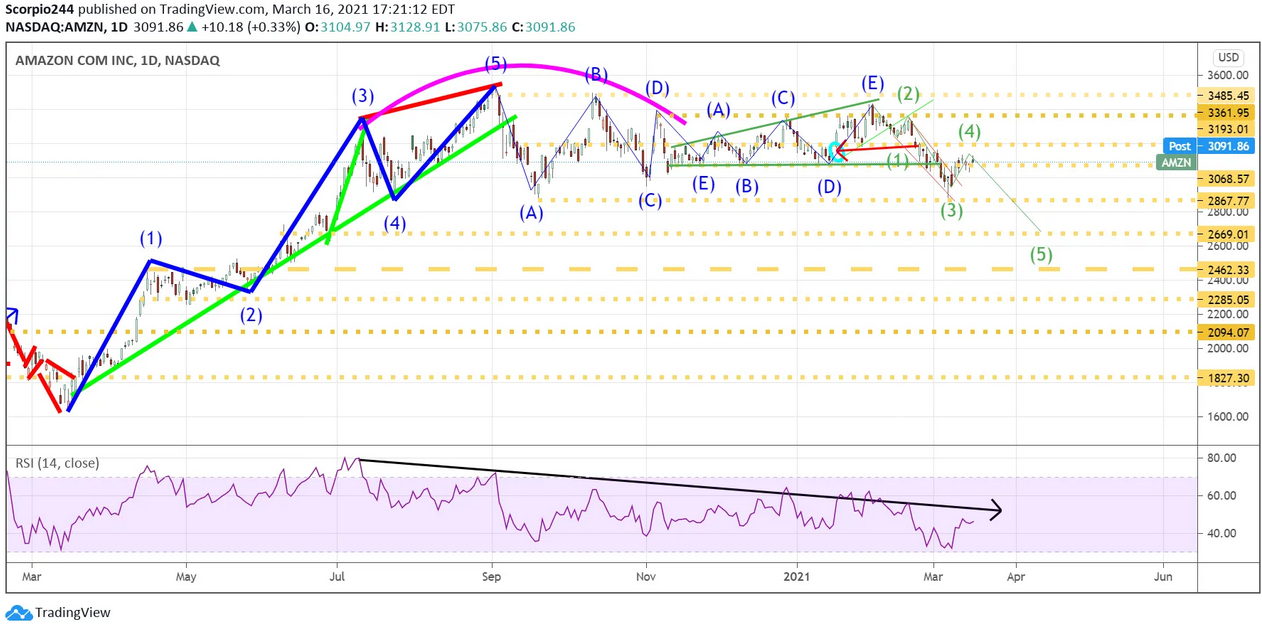
The problem is also that Amazon (NASDAQ:AMZN) seems to reflect the same idea. Lower prices still lie ahead.
Today is going to be interesting one way or another.
