Stocks continue to be on a rip higher. The S&P 500 is now 13% above its 200-day moving average, the highest spread since January 2018. Meanwhile, volatility has begun to pick up as well. I’ve mentioned in my subscriber letter and publicly on Twitter the rising correlation between stocks and vol; which is now at its highest level since January 2018. The VIX has been positive along with SPX for the last two days, catching many trader’s eye since these two typically don’t move higher very often for multiple days in a row.
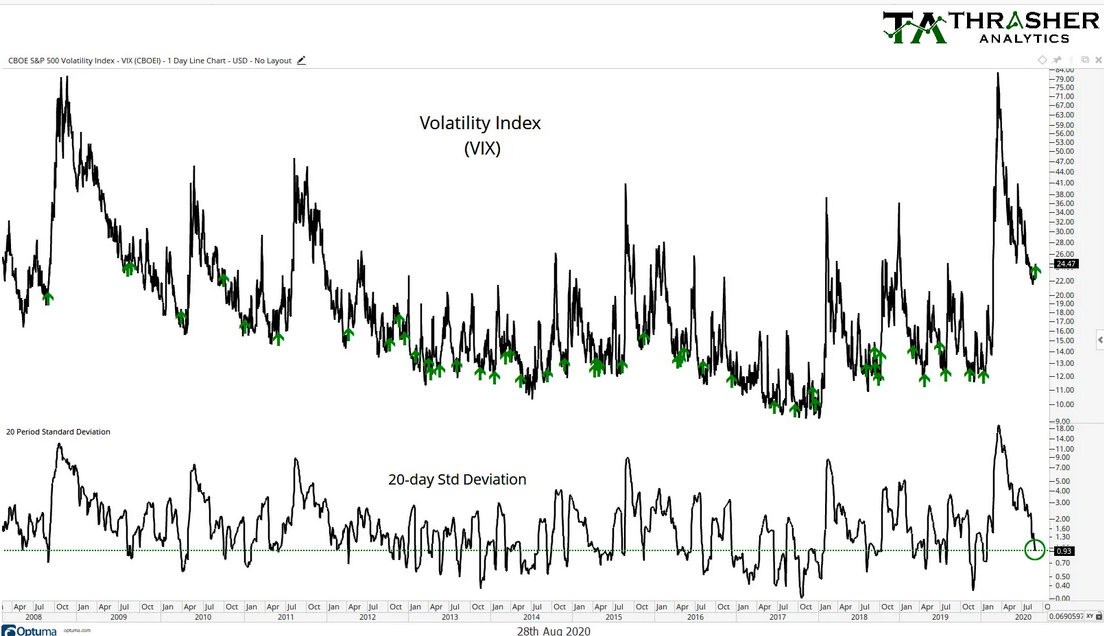
All this seems has been developing while volatility dispersion has been contracting. For long-time readings of my blog, this concept should sound familiar as it was the topic of my 2017 Charles Dow Award winning paper, Forecasting a Volatility Tsunami. In the paper I discuss how spikes in Volatility are almost always preceded by a contraction in daily dispersion (i.e. standard deviation). However not every time dispersion contracts does volatility spike. I liken this to dark clouds forming in the sky signaling the potential for a thunderstorm but it by no means is it a guarantee it will rain.
I use this concept often within my writing, building upon it more nuanced approaches to volatility and risk management analysis. The chart below shows the current picture of volatility dispersion along with the 20-day standard deviation, which is the tool used within my paper. I’ve included green arrows to show prior occurrences of std dev dropping to its current level of 0.93. It’s definitely been lower than it is today, but it’s entered the territory that’s often marked a turning point for the VIX to move higher, most recently early January of this year. I talked about this in my segment Friday morning on TD Ameritrade Network.

This is just one tool among many that can be used to evaluate market risks. I believe it works best when paired with other forms of analysis. I view volatility dispersion as a sign of excessive confidence in equity volatility remained low, which often turns out to not be the case after all. I’ll repeat something I said earlier, just because dispersion declines does not signal the requirement for volatility to spike higher. Instead, it creates the environment for such a spike to occur, whatever the eventual catalyst may be.
Disclaimer: Do not construe anything written in this post or this blog in its entirety as a recommendation, research, or an offer to buy or sell any securities. Everything in this post is meant for educational and entertainment purposes only. I or my affiliates may hold positions in securities mentioned in the blog. Please see my Disclosure page for full disclaimer. Connect with Andrew on Google+, Twitter, and StockTwits.
