Get 40% Off
🚨 Volatile Markets? Find Hidden Gems for Serious OutperformanceFind Stocks Now

VIX Turning Lower On The Weekly Chart On Tradestation

Published 10/14/2019, 08:24 AM
Updated 07/09/2023, 06:31 AM
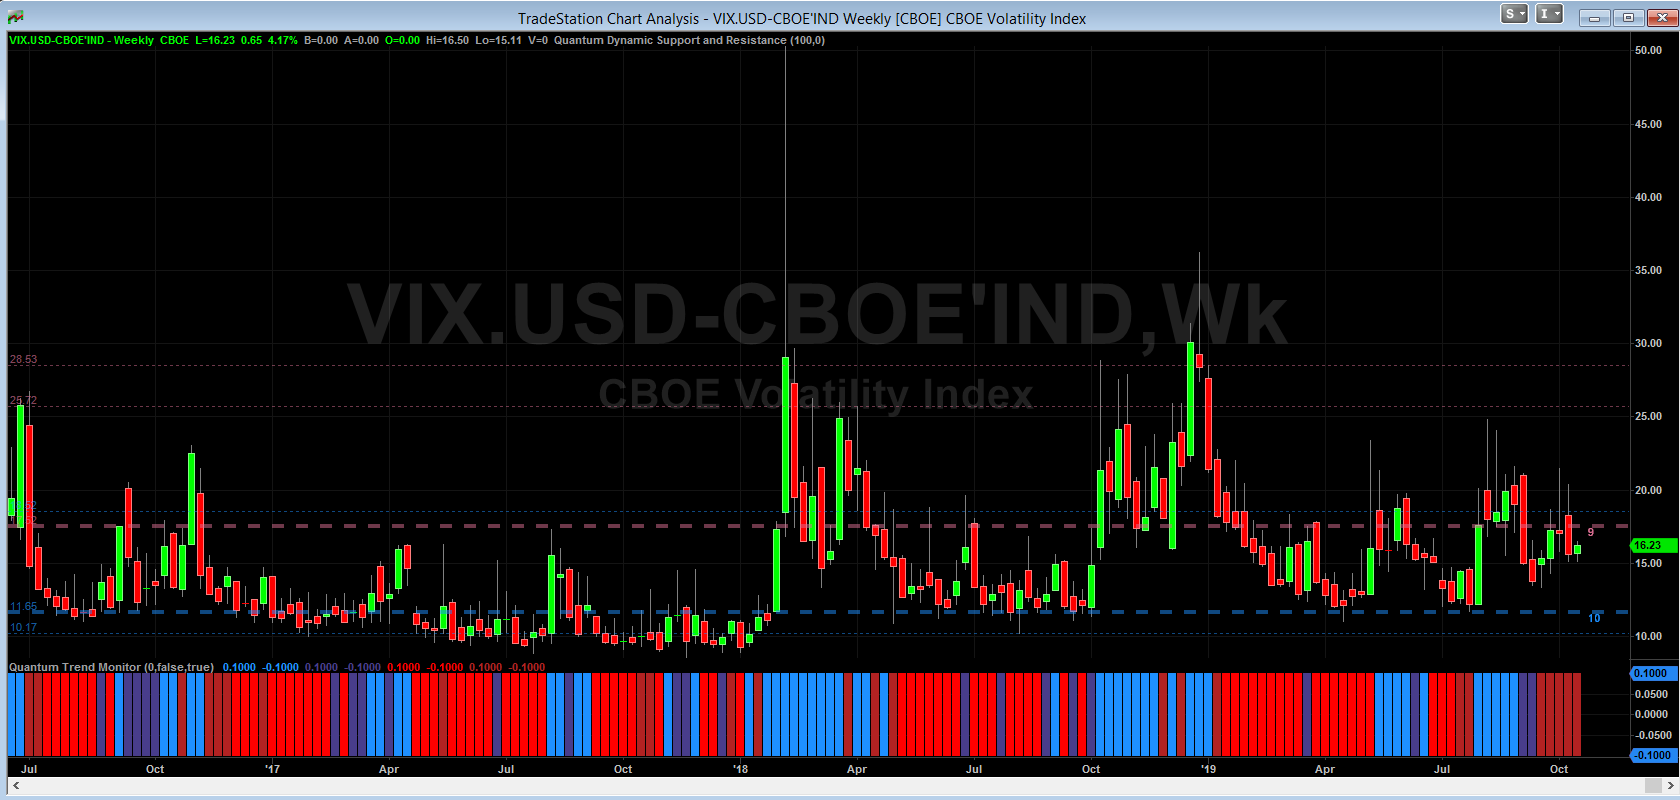
VIX Weekly Chart

A chart which should be on every trader’s workspace is the VIX, the volatility index based on the S&P 500 and out of the money puts and calls, as it provides a view on future volatility and is therefore often referred to as the fear index. As the VIX falls so equity markets rise and vice versa and so reflects the ebb and flow in risk sentiment.

The weekly chart for the VIX describes the price action for the S&P 500 – the bellwether index for risk appetite and sentiment and is represented here perfectly on the Tradestation platform using the Interactive Brokers feed, where the index has been oscillating in a relatively narrow range, despite some extreme price swings in the cash markets.

As we can see, other than the two extreme highs of early 2018 and 2019, the bulk of the price action is contained below the 30 price point, and there is also an extremely strong platform of support in the 11.00 area as denoted with the support and resistance indicator for Tradestation with the blue dashed line. This support level has been tested repeatedly since April and also reflects the resistance now building across all the primary indices on their respective daily charts, and until this level is breached, the indices will continue to remain waterlogged driven by risk on and risk off sentiment as the trade wars continue with China and begin with Europe.

Much of the recent market euphoria centred on Chinese comments concerning an offer to hold off manipulating their currency as a mechanism to offset tariffs. Whether such a ‘currency pact’ is agreed and holds remains to be seen, and if so, we can expect to see the VIX decline further and return to test the 11 region in due course. Note the trend monitor indicator for Tradestation is also reverting to a bearish tone once more with deep wicked candles helping to drive the index lower. Overhead we have equally strong resistance in the 17.00 area and denoted with the red dashed line of the support and resistance indicator for Tradestation which was breached on Friday and so helping to pressure the index lower.

3rd party Ad. Not an offer or recommendation by Investing.com. See disclosure here or remove ads .

Latest comments

Risk Disclosure: Trading in financial instruments and/or cryptocurrencies involves high risks including the risk of losing some, or all, of your investment amount, and may not be suitable for all investors. Prices of cryptocurrencies are extremely volatile and may be affected by external factors such as financial, regulatory or political events. Trading on margin increases the financial risks.
Before deciding to trade in financial instrument or cryptocurrencies you should be fully informed of the risks and costs associated with trading the financial markets, carefully consider your investment objectives, level of experience, and risk appetite, and seek professional advice where needed.
Fusion Media would like to remind you that the data contained in this website is not necessarily real-time nor accurate. The data and prices on the website are not necessarily provided by any market or exchange, but may be provided by market makers, and so prices may not be accurate and may differ from the actual price at any given market, meaning prices are indicative and not appropriate for trading purposes. Fusion Media and any provider of the data contained in this website will not accept liability for any loss or damage as a result of your trading, or your reliance on the information contained within this website.
It is prohibited to use, store, reproduce, display, modify, transmit or distribute the data contained in this website without the explicit prior written permission of Fusion Media and/or the data provider. All intellectual property rights are reserved by the providers and/or the exchange providing the data contained in this website.
Fusion Media may be compensated by the advertisers that appear on the website, based on your interaction with the advertisements or advertisers.
© 2007-2024 - Fusion Media Limited. All Rights Reserved.