
Riding on higher revenues, Visa Inc. (NYSE:V) posted second-quarter fiscal 2017 (ended Dec 31, 2016) earnings of 86 cents per share, beating the Zacks Consensus Estimate of 79 cents. Also, the bottom line improved 27% year over year.
Results were driven by the acquisition of Visa Europe and solid growth in payments volume as well as processed transactions. Notably, USAA and Costco (NASDAQ:COST) volumes continued to drive U.S. credit growth. However, on the down side, the quarter witnessed higher expenses.
Visa Europe Acquisition Drives Revenues
Net operating revenue of $4.5 billion surpassed the Zacks Consensus Estimate of $4.2 billion. Also, revenues climbed 23% year over year. This upside was primarily driven by the acquisition of Visa Europe and consistent growth in cross-border volume and processed transactions.
On a constant dollar basis, payments volume growth for the reported quarter surged 37% year over year to $1.7 trillion. Cross-border volume growth was 132% for the quarter ended Mar 31, 2017. Cross-border volume growth, on a constant dollar basis when normalized for Europe, was 11% year over year. This growth was partly offset by adverse foreign exchange movement.
Total processed transactions for the reported quarter were 26.3 billion, reflecting a 42% rise year over year. When normalized for Europe, total processed transactions growth was 12% over the prior year quarter.
Service revenues increased 17% year over year to $2.0 billion on payments volume in the prior quarter. Notably, other revenue components are based on the reported quarter’s activity. Data processing revenues were up 25% on a year-over-year basis to $1.8 billion, while international transaction revenues surged 41% to $1.5 billion. Other revenues advanced 3% year over year to $203 million.
Client incentives of $1 billion represented 18.7% of gross revenues in the reported quarter.
Adjusted operating expenses increased 24% year over year to $1.5 billion, mainly reflecting the inclusion of Visa Europe’s operating expense.
Foreign exchange rate shift negatively impacted earnings per share growth by approximately 4%.
Financial Update
Cash, cash equivalents, and available-for-sale investment securities were $10.7 billion as of Mar 31, 2017, down from $13.2 billion as of Dec 31, 2016. Total assets were $63.2 billion as of Mar 31, 2017.
Share Repurchase Update
Visa repurchased shares worth $1.7 billion during the quarter. The board of directors authorized a new $5.0 billion class A common stock share repurchase program and the company currently has $7.2 billion of funds available for share repurchase.
Visa Inc. Price, Consensus and EPS Surprise
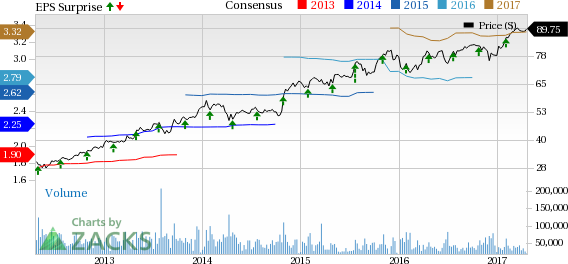
Visa Inc. Price, Consensus and EPS Surprise | Visa Inc. Quote
Fiscal 2017 Guidance
This outlook includes integration expenses associated with the Visa Europe buyout for about $80 million.
For fiscal 2017, Visa largely reaffirmed its guidance. Annual operating margin is anticipated at mid-60%, while client incentives are expected to account for 20.5–21.5% of gross revenue. Additionally, the effective tax rate projection has been reiterated at 30%.
Visa reaffirmed annual net revenue growth in a range of 16–18% with an adverse foreign currency impact of 2–2.5%. Also, adjusted earnings per share growth was reiterated at mid-teens digit on a normal dollar basis, including 2.5–3% of negative foreign currency impact.
Our Take
Visa’s results reflect robust performance. The company remains well positioned for growth on the back of its solid market position and significant opportunities from its secular shift toward electronic payments. However, high client incentives and litigation issues remain as concerns.
Another player in the same space American Express Co. (NYSE:AXP) also came up with flying colors, with earnings of 1.34 per share for the Jan–Mar 17 quarter beating the Zacks Consensus Estimate by 4.7%.
Visa carries a Zacks Rank #2 (Buy).You can see the complete list of today’s Zacks #1 Rank stocks here.
Other players that look poised to beat on the quarter’s earnings are:
Discover Financial Services (NYSE:DFS) with an Earnings ESP of +1.41% and a Zacks Rank #3 (Hold). The company is expected to report first-quarter earnings results on Apr 25.
Moody’s Corporation (NYSE:MCO) has an Earnings ESP of +0.84% and a Zacks Rank #2. The company is expected to report first-quarter earnings results on May 5.
More Stock News: 8 Companies Verge on Apple-Like Run
Did you miss Apple (NASDAQ:AAPL)'s 9X stock explosion after they launched their iPhone in 2007? Now 2017 looks to be a pivotal year to get in on another emerging technology expected to rock the market. Demand could soar from almost nothing to $42 billion by 2025. Reports suggest it could save 10 million lives per decade which could in turn save $200 billion in U.S. healthcare costs.
A bonus Zacks Special Report names this breakthrough and the 8 best stocks to exploit it. Like Apple in 2007, these companies are already strong and coiling for potential mega-gains. Click to see them right now >>
Moody's Corporation (MCO): Free Stock Analysis Report
Discover Financial Services (DFS): Free Stock Analysis Report
American Express Company (AXP): Free Stock Analysis Report
Visa Inc. (V): Free Stock Analysis Report
Original post
Zacks Investment Research