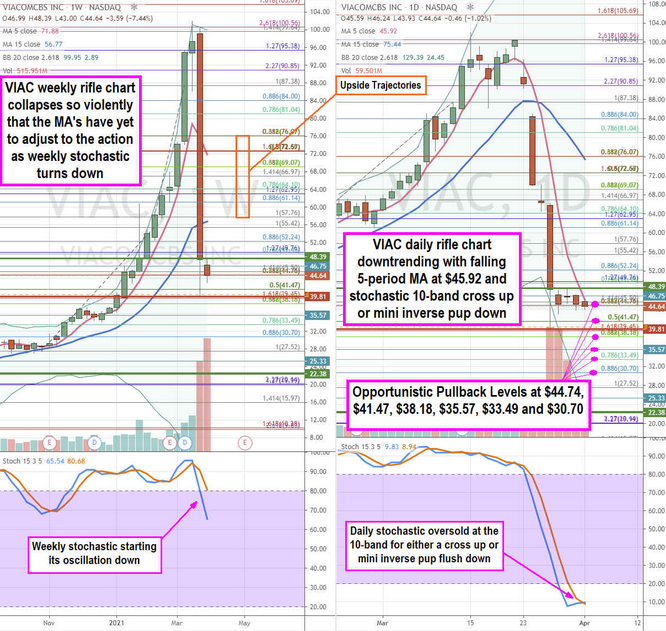
Media behemoth ViacomCBS (NASDAQ:VIAC) stock had a meteoric rise and violent collapse on the heels of the Archegos forced liquidation margin call selling. Shares collapsed nearly (-60%) in four trading days accelerated by the forced liquidation of nearly $20 billion in VIAC shares.
Skeptical investors questioned the excessive and questionable run up to $100 preceding the sell-off. When the Company announced a nearly $3 billion secondary offering on March 24, 2021, volatility spiked as shares collapsed in extreme fashion uncovering margin calls resulting from the extreme leverage implemented by Archegos Capital Management.
Fears surrounding a contagion effect rose after Credit Suisse (SIX:CSGN) warned of a significant material impact from losses stemming from an unnamed U.S. hedge fund, while Nomura Securities claimed nearly $2 billion in losses. Selling quickly spread to shares of Goldman Sachs (NYSE: GS) and Morgan Stanley (NYSE:MS) as these firms were actively liquidating blocks of shares. However, the backdrop of benchmark indices hitting new all-time highs as largely taken the spotlight off the U.S. investment banks for now. Risk-tolerant investors seeking a long-term value play can monitor opportunistic pullback levels of ViacomCBS to consider taking exposure.
Q4 2020 Earnings Release
On Feb. 24, 2021, ViacomCBS released Q4 2020 results for the quarter ending in December 2020. The Company reported earnings per share (EPS) of $1.04 excluding non-recurring items, beating consensus analyst estimates of $1.01, by $0.03. Revenues grew 3.3% year-over-year (YoY) to $6.87 billion, beating analyst estimates by $200 million.
Adjusted OIBDA grew 5% YoY to $1.18 billion. Streaming and Digital video sales rose to $888 million from $519 million, YoY. U.S. streaming subscribers rose 71% to 19.2 million. CBS All Access and SHOWTIME OTT delivered their best quarter ever for sign-ups. CBS ALL Access was driven by demand for sports content including NFL, UEFA, and SEC as well as original programming.
Global streaming subscribers grew to 30 million and Pluto TV Global monthly-active-users (MAUs) rose to 43 million, up 81% YoY. Affiliate revenues rose 13% YoY, and Advertising revenues rose 4% YoY. The Company owned the most top 30 cable networks among viewers between ages of 18 to 49 and 9 of the 10 original series with kids between 2 to 11 years old.
The Company generated $2.2 billion of operating cash flow from continuing operations and $1.98 billion of free cash flow. As of Dec. 31, 2020, the Company had $3 billion in cash and $3.5 billion in revolving credit that hasn’t been tapped.
VIAC Secndary Offering
On Mar. 24, 2021, ViacomCBS announced a $2.65 billion stock offering composed of 20 million Class B common shares priced at $85 and 10 million 5.75% Series A mandatory convertible note with liquidation preference price at $100 per-share. The convertible shares automatically convert to Class B shares on Apr. 1, 2024. Underwriters were granted the option to purchase an additional 2 million Class B shares and 1.5 million preferred shares within 30 days, which could boost total proceeds to $3.06 billion, but likely not. Subsequently, the offering kicked off the sell-off in shares as the stock closed just three days prior at $100.34 on March 22, 2021. Just two days after the announcement, shares collapsed to lows of $39.81 spurred by nearly $20 billion in block sales.
Archegos Capital Liquidation
The extreme selling on VIAC stock on March 26, 2021, spread into various other and seemingly unrelated stocks ranging from Discovery Networks (NASDAQ:DISCA), Baidu (NASDAQ:BIDU), Tencent (NYSE:TME), Vipshop (NYSE:VIPS), Farfetch (NYSE:FTCH), and iQIYI (NASDAQ:IQ)).
The relationship between these stocks revealed themselves to be forced liquidations stemming for margin calls linked to a little known family office Archegos Capital Management, operated by former Tiger Management Asia fund manager David Hwang. Details are still murky, but the formerly blacklisted fund manager is at the center of many highly leveraged bets that exploded triggering a domino effect of forced liquidations in its holdings. While shareholders have been hurt, the sell-off may present opportunistic pullback levels for prudent risk-tolerant investors with a longer time frame horizon in shares of VIAC.

VIAC Opportunistic Pullback Levels
Using the rifle charts on weekly and daily time frames provides a near-term view of the landscape for VIAC stock. The weekly rifle chart uptrend lasted for 19 weeks before peaking near the $100.56 Fibonacci (fib) level. The violent collapse sliced right through the weekly 5-period moving average (MA) at $71.88 and 15-period MA at $56.77 as the weekly stochastic falls through the 80-band.
The daily rifle chart breakdown has caught down to the share price with a 5-period MA resistance at $45.92 with a deeply lagging 15-period MA near the $76.07 fib. The daily market structure low (MSL) buy triggers above $48.39, while a weekly market structure high (MSH) sell triggers on a break under $39.81.
The daily stochastic has fallen to the 10-band with a possible cross up once the 5-period MA can break or a rejection on the daily 5-period MA can trigger a mini inverse pup flush down. Risk-tolerant investors can monitor opportunistic pullback levels at the $44.74 fib, $41.47 fib, $38.18 fib, $35.57 fib, $33.49 fib, and the $30.70 fib. Upside trajectories range from the $57.76 fib upwards to the $76.07 fib level.
