The Final Stage of a Crack-Up Boom
For economists the dire downward spiral of Venezuela’s economy holds the same fascination black holes hold for physicists. Both illustrate what happens amid the most extreme conditions imaginable. It is thought that this may potentially provide clues of a more general nature. The remnants of massive imploded stars are inanimate and many light years distant; regardless of how violent conditions in their vicinity are, they cannot touch us. Unfortunately, extreme economic conditions definitely involve a great deal of human suffering.
“We are the humanist socialism that will save the world”, from Venezuelan cartoonist Weil (he always draws the dear leaders with big wads of dollars sticking out of their pockets, making them look like otherworldly birds – look for his work on the intertubes).
From the perspective of Austrian economic theory, a hyperinflation event essentially represents a highly compressed, extreme version of the boom-bust cycle referred to as a “crack-up boom” (note: the original German term coined by Ludwig von Mises was “Katastrophenhausse” – the literal translation would be “catastrophic boom”).
In a past article on forced saving we inter alia discussed the post WW I crack-up boom in the Weimar Republic, one of the most infamous hyperinflation events in history. The data available on this disaster are remarkably comprehensive and detailed and demonstrate that Austrian capital and business cycle theory indeed offers the by far most accurate explanation of the boom-bust cycle.
Recent developments in Venezuela are very similar. There is definitely a crack-up boom underway, but it differs of course in a number of details from the Weimar experience. Every slice of economic history is unique in some way after all, but the underlying economic laws driving economic history nevertheless remain universally and time-invariantly applicable.
Not too long ago our good friend Keith Weiner also mentioned Venezuela, mainly in the context of criticizing too simplistic views of the factors driving price inflation such as the quantity theory of money). Obviously the supply of money is just one of these drivers – the demand for money and the supply of and demand for goods and services are the others.
This is also why the purchasing power of money is not truly measurable, as no fixed yardstick to measure it with exists. There is no such thing as a “general level of prices” anyway – this is a logical fallacy. Keith correctly points out that in Venezuela – and this is something one can observe in almost all hyperinflation cases – it is not only money printing that has triggered the slump in purchasing power, but also a collapse in production, which has happened for more than one reason.
As assorted socialists comtinually assure us, what they have in Venezuela is luckily not “real socialism”. They were definitely full of praise for “Chavismo” though when high oil prices still helped mask the crumbling of the country’s economy. Some people such as Jeremy Corbyn no longer even mention Venezuela nowadays, after frequently informing us in the past how wonderful Chavez-style socialism was.
In Venezuela production collapsed very quickly after the socialist dictatorship of Chavez (and later Maduro) weakened property rights to such an extent that no sane person was prepared to take entrepreneurial risks with their capital any longer.
The entire gamut of interventions from the imposition of price controls to outright confiscation of businesses was implemented with the aim of transforming Venezuela into a full-scale command economy. Amid heavy money printing and a concomitant slump in production and imports, the demand for money eventually collapsed as well – triggering the hyperinflation phase.
It should be pointed out that capital consumption was already quite advanced before the advent of Venezuela’s socialist rulers, as their predecessors had gradually undermined the market economy for decades. Naturally, these previous interventions were also accompanied by a lot of money printing.
All interventionist governments consider the suppression of interest rates to be a cure-all – and it can of course mask structural economic problems for quite some time, as a rule up to the point when the bulk of previously accumulated capital has been consumed.
Empty shelves in supermarkets in Caracas have been the “new normal” for more than four years now. Not only has domestic production collapsed, but imports have declined precipitously as well. Holding on to cash balances denominated in the domestic currency makes no sense and a major “flight into real values” has been underway for quite some time.
Pictures of an Economic State of Emergency
We have quite a comprehensive collection of charts pertinent to the hyper-inflationary crack-up boom in Venezuela and decided to put the most interesting ones into a post (most of the charts are fairly up-to-date, but keep in mind that things are moving very fast in late stage hyperinflation).
Recently the government decided to shave off five zeros from its currency (on August 18 to be precise), which is reminiscent of the 1000 for one reverse split applied to the IBC stock market index in Caracas a few years ago (i.e., they took off just three zeros in this case).
One similarity is already ominously obvious: the collapse of the value of the Venezuelan bolivar (VEF) has immediately accelerated in the wake of the “currency reverse split”. The stock market rally also accelerated shortly after the index was robbed of three zeros.
Presumably this is mainly a psychological effect. Anyway, we have made charts of the exchange rate in which we simply ignored the removal of the five zeros. Eventually we will adjust all past numbers, but it won’t really make a difference – the charts will look exactly the same. For starters, here is a log chart of the black market rate of the VEF vs. the USD (“black market rate” in this case simply means “market price”).
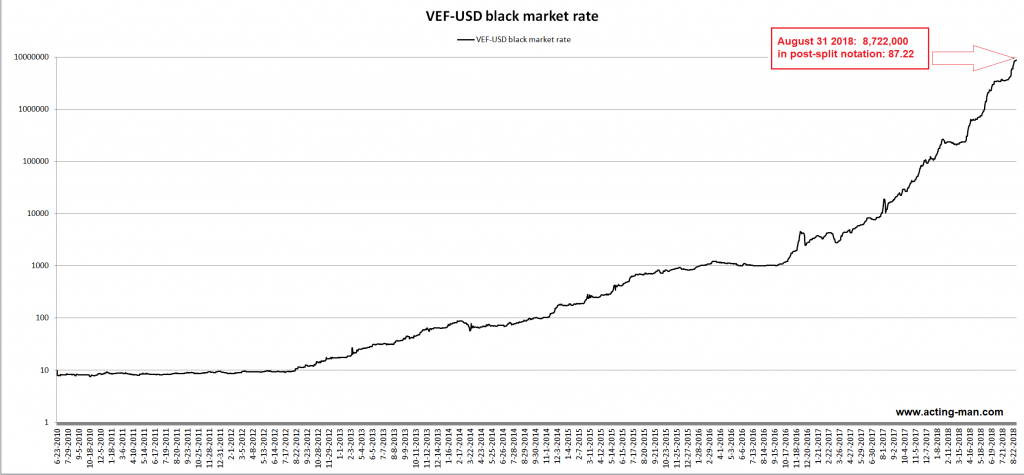
A log chart of the VEF/USD exchange rate. In 2010 VEF-USD traded just above 8 bolivares per dollar in the black market. As of today it stands at more than 8.7 million bolivares per dollar (or 87.22 using the post-split value, which compares to a VEF-USD rate of 0.0008 in 2010) – note the acceleration after the “reverse split” – on August 18, one day before the five zeros were shaved off, VEF-USD stood at around 5.9 million.
A linear chart from August 2014 to today shows how the move in the exchange rate accelerated as hyperinflation really took off and the bolivar essentially ceased to be a viable medium of exchange. Moves prior to 2017 are not really visible on this chart, but it is inter alia easier to show clearly at which point the “reverse split” was implemented. As noted above, the decline in the exchange rate accelerated even further in the wake of the decision.
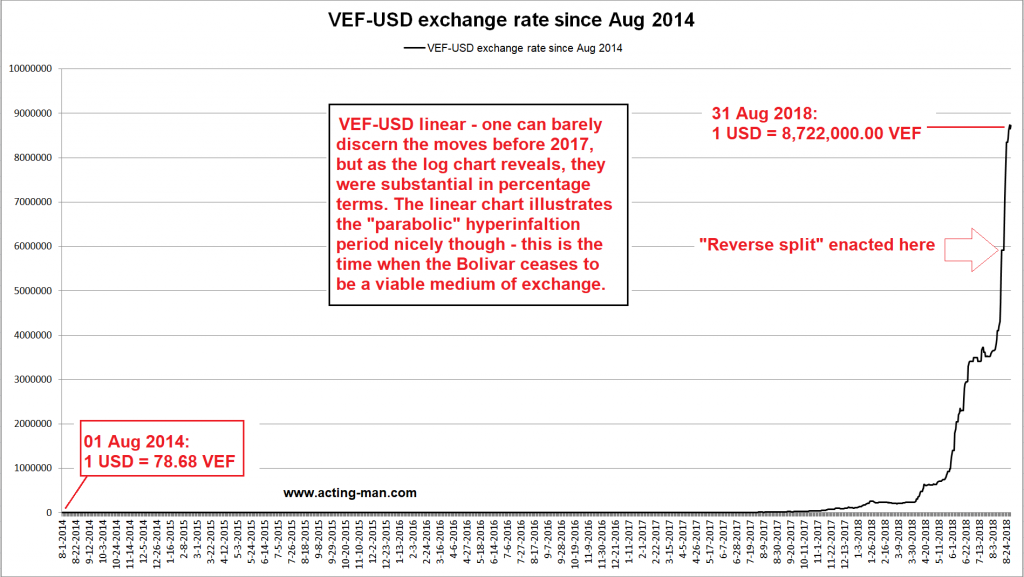
A linear chart of VEF-USD from 01 August 2014 to 31 August 2018. Within just 12 days after the introduction of the “new” bolivar, it moved from 59 to 87 (or from 5.9 million to 8.7 million in “old” bolivar terms).
Professor Steven Hanke of John Hopkins University runs the “Troubled Currencies Project” for the Cato Institute – he uses exchange rates to derive an implied inflation rate for the countries concerned. Although price inflation is not really measurable, this does provide us with a rough idea of how quickly the purchasing power of these currencies is vanishing.
The most recent chart of Venezuela’s implied inflation rate we have found is as of August 19, shortly after the government introduced the “new” bolivar. Since implied inflation stands at 61,670% as of August 30, it seems actually likely to us that a typo was made in the annotation and the chart refers to the situation as of August 29 rather than August 19. In any case, it is fairly current.
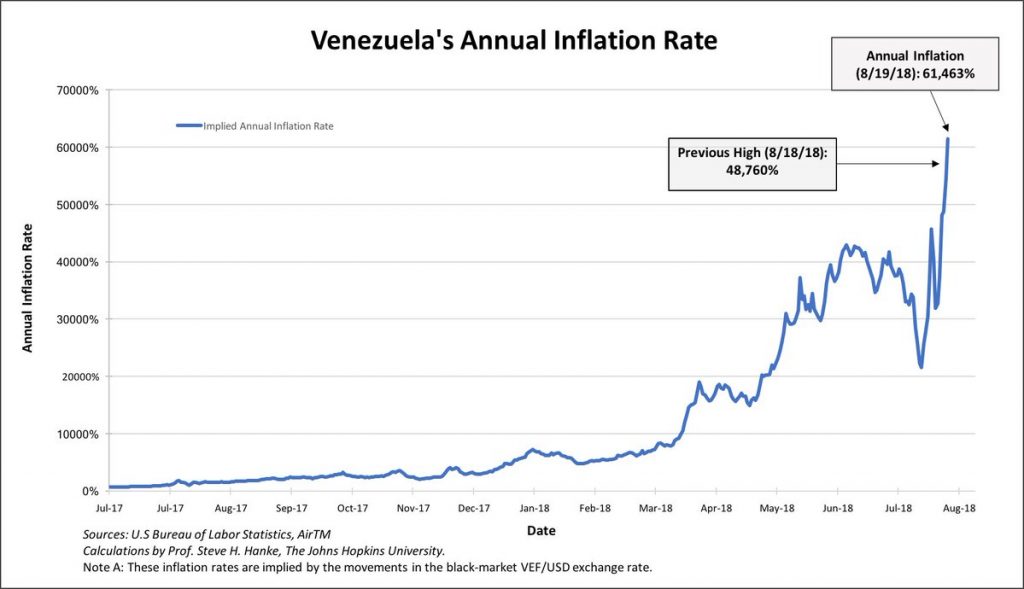
Venezuela’s implied annual inflation rate via Professor Hanke – on August 30 it reached 61,760%.
The next chart shows Venezuela’s narrow money supply M1 since 2008 – unfortunately we could not find a log chart going back that far, so one can only discern the “parabolic printing phase” that began in 2016 – 2017.
We calculated that Venezuela’s money supply growth amounts to 46.68 billion percent since the early 1960s. On a log chart one would no doubt see that extremely generous money printing has been practiced for a very long time (it would probably look very similar to the log chart of the exchange rate above).
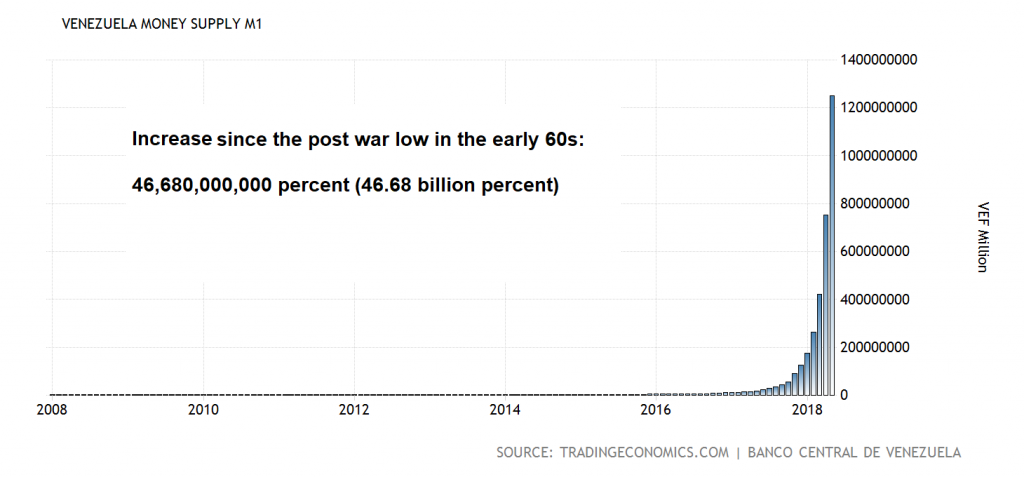
Venezuela’s narrow money supply M1 – up 46.68 billion percent since the early 1960s. Its growth rate has accelerated markedly in the past several years.
This brings us to the miraculous Caracas stock market, which has soared amid a collapse in economic output – a symptom of the “flight into real values”, as stocks represent claims on real assets.
Despite the little joke we have pinched from Kyle Bass and added to the annotation, the stock market has actually preserved purchasing power quite well in recent years. There is only one problem: once the inflation phase ends, which it must one day, the subsequent “stabilization crisis” will result in a sharp fall in the prices of the stocks that have rallied the most, as the economy’s structure of production will have to be completely rearranged.
Many investors will find it very difficult to decide when to get out and move into different sectors or different types of investments – and the class of investors as a whole won’t be able to escape the coming losses anyway. In Weimar Germany several of the biggest and most prominent winners of the crack-up boom lost their entire fortunes after hyperinflation came to a sudden halt in late 1923.
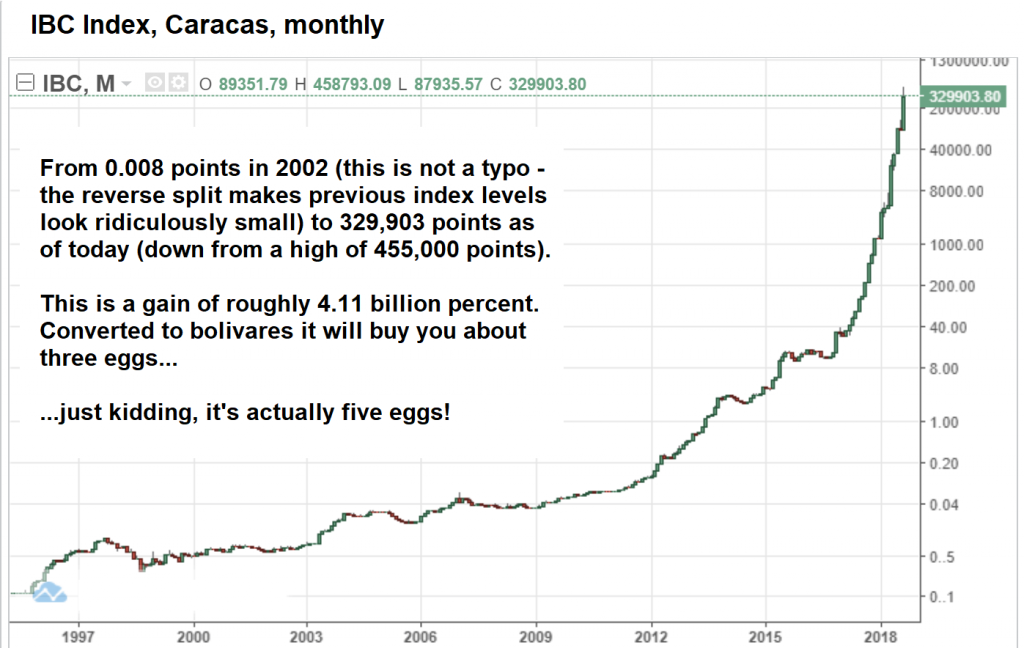
IBC Index, monthly – a gain of 4.11 billion percent since the low of 2002.
With respect to declining production, we have two more charts – one shows the slump in Venezuelan oil production compared to the surge in US oil production (note that Venezuela has the largest oil reserves in the world) and the other shows official GDP growth numbers – which are only released intermittently these days.
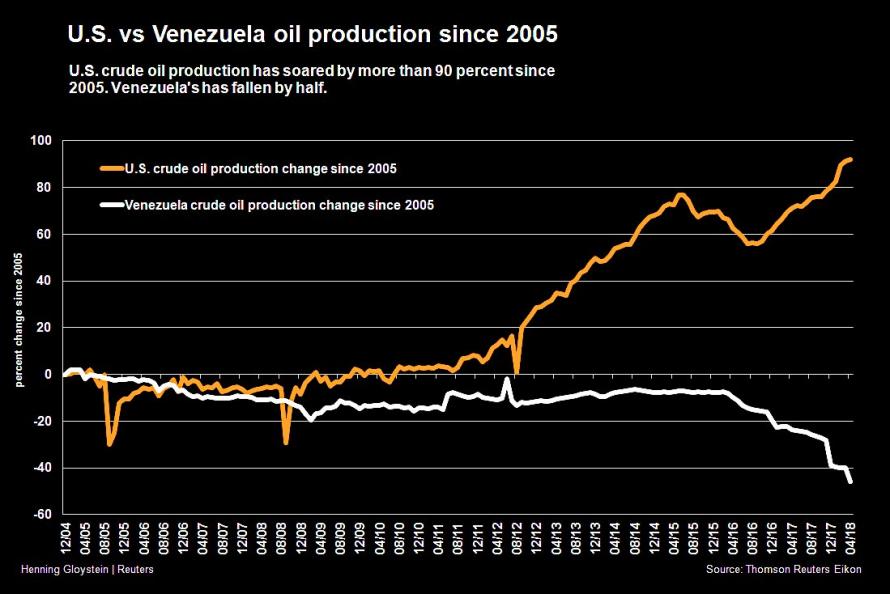
US vs. Venezuela crude oil production from early 2005 to April 2018
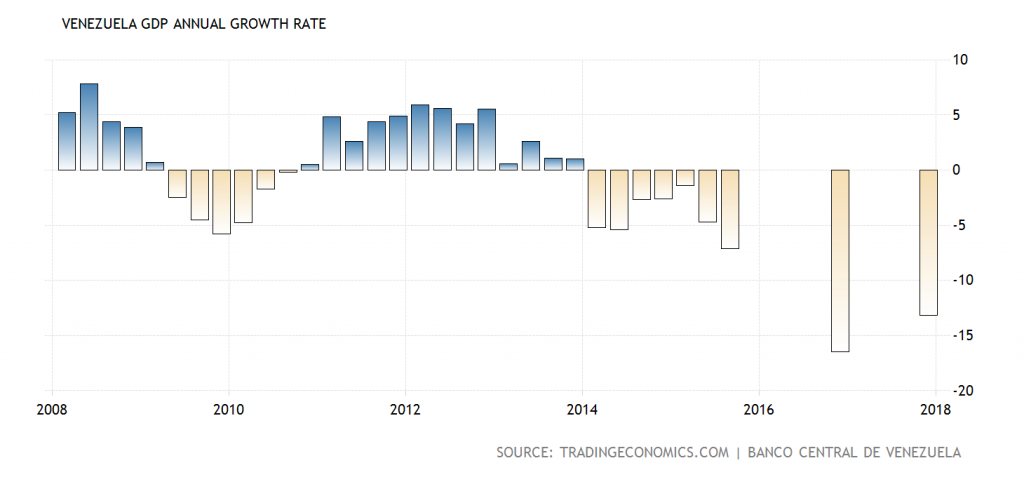
Annualized GDP growth according to official statistics – since 2016 these data are only released sporadically, and we are not sure how accurate they are.
