Has the tipping point for the value factor’s renaissance in U.S. equities finally arrived?
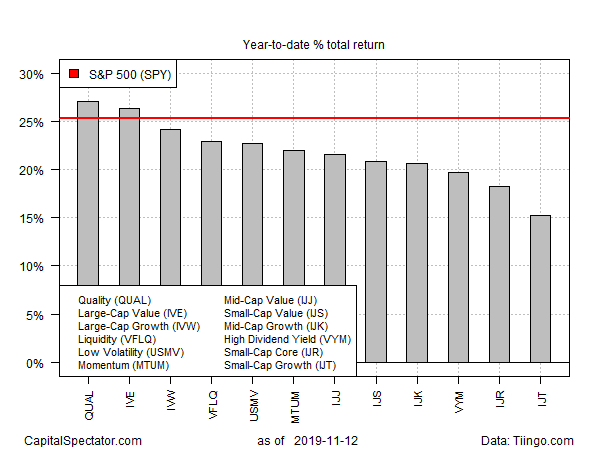
It has if we’re keeping score on a year-to-date basis with a set of representative exchange-traded funds. Proxies for the large-, mid- and small-cap corners show a common theme: value tops growth.

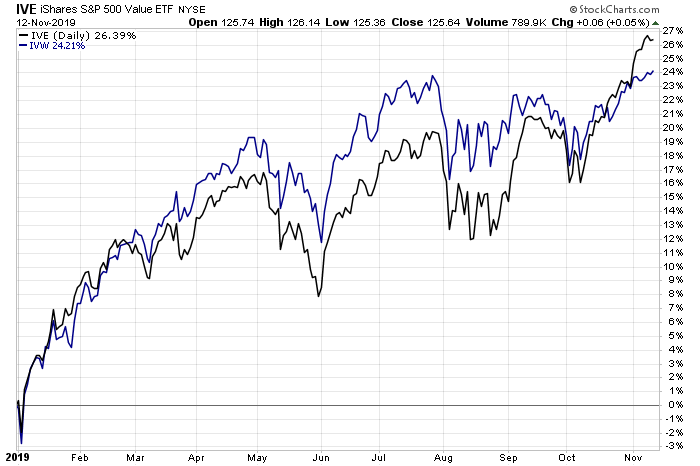
Let’s start with large cap. The iShares S&P 500 Value (NYSE:IVE) is up 26.4% so far this year (through Nov. 12), modestly ahead of iShares S&P 500 Growth (NYSE:IVW). That’s hardly a dramatic edge, but it’s notable that big-cap value is no longer eating growth’s dust.
A similar story applies for mid-cap value over mid-cap growth (IJJ vs. IJK, respectively).
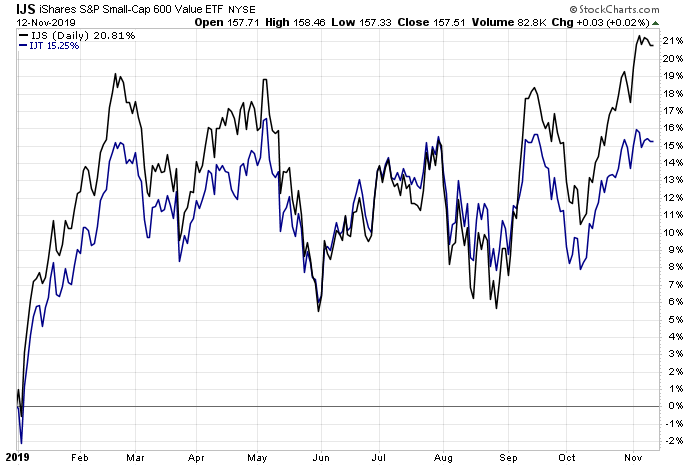
Ditto in the small-cap space, although value’s spread over growth is more conspicuous. The iShares S&P Small-Cap 600 Value (NYSE:IJS) is enjoying a 20.8% total return year to date – a solid lead over the 15.3% gain for iShares S&P Small-Cap 600 Growth (NASDAQ:IJT).

Note, too, that small-cap growth is currently in last place for US equity factors overall this year. Meantime, the quality factor leads everything: iShares Edge MSCI USA Quality Factor (NYSE:QUAL) is up a hair over 27% in 2019 through yesterday’s close.

By some accounts, the recent revival in value appears linked to compelling relative valuations vs. other factors. For example, “Value has never been this cheap vs. Momentum,” Savita Subramanian, head of US equity and quantitative strategy at Bank of America Merrill Lynch (NYSE:BAC), wrote last Friday in a research note. “Many signals indicate that the recent rotation into Value/out of Momentum could continue.”
Horan Capital Advisors observed a few days ago that “value is outperforming growth again and this might be sustainable into 2020,” adding that “for value to have an edge over growth though, financials and consumer discretionary stocks will likely need to be strong performers.”
Financials and consumer discretionary stocks, as a group, account for 50% of the Guggenheim Invest S&P 500 Pure Value (NYSE:RPV). In 2016 these two sectors accounted for more than half of value’s outperformance and at that time the two sectors were 40% of the Pure Value Index. Additionally, on a relative basis, if technology and healthcare stocks are laggards in 2020, this will benefit the Pure Value style as the two sectors are underweight in the pure value style relative to the pure growth style.
A top quant at JP Morgan also thinks that value’s recent performance edge has legs. “Our view is that this rotation should continue in Q4 and Q1,” Marko Kolanovic told CNBC on Friday, citing several productive trends. “Since September, we had further easing of monetary policy globally, progress on a trade deal, and most importantly turnaround in various macro indicators.”
