Almost all valuation multiples are flashing that stocks are dangerously overvalued. Are there any valuation models suggesting that the danger signals might be false alarms?
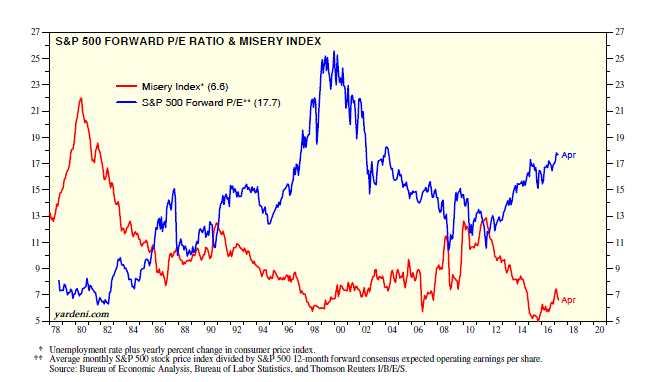
There is one. It shows the inverse relationship since 1979 between the S&P 500 forward P/E and the Misery Index, which is the sum of the unemployment rate and the CPI inflation rate. Let’s have a look at it and compare it to a few of the other valuation indicators:
(1) Misery Index very bullish. During April, the Misery Index was down to 6.6%, near previous cyclical lows. That’s down 6.3-ppts from its most recent cyclical peak of 12.9% during September 2011. Over this same period, the forward P/E has risen from roughly 10 to 17, well above its average of 13.8 since September 1978.
The theory is that less misery should justify a higher P/E. A low unemployment rate should be bullish for stocks unless it is accompanied by rising inflation, which could cause the Fed to tighten to the point of triggering a recession and driving the jobless rate higher. Nirvana should be a low unemployment rate with low inflation, which seems to be the current situation. In this happy state, a recession is nowhere to be seen, which should justify a higher valuation multiple.
I construct a “misery-adjusted” P/E simply by summing the S&P 500 forward P/E and the misery index. It has been trendless and highly cyclical since September 1978, with an average of 23.9. Its low was 18.5 during November 2008, and its high was 33.0 during March 2000. During April, it was 24.3, in line with its average. That’s somewhat comforting.
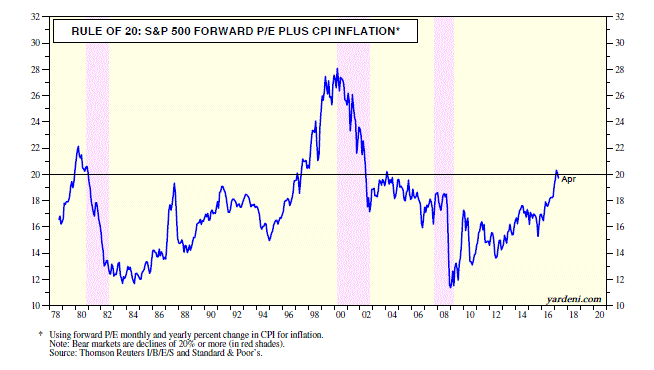
(2) Rule of 20 no longer a buy signal. Less comforting is the Rule of 20, which tracks the sum of the S&P forward P/E plus the CPI inflation rate. So it is the same as the misery-adjusted P/E less the unemployment rate. I moved to CJ Lawrence in 1991. My mentor there was Jim Moltz, who devised the Rule of 20, which states that the stock market is fairly valued when the sum of the P/E and the inflation rate equal 20. Above that level, stocks are overvalued; below it, they are undervalued.
The rule was bearish just prior to the bear market at the start of the 1980s. It was wildly bullish for stocks in the first half of the 1980s. It turned very bearish in the late 1990s and bullish again a couple of years later in mid-2002. Those were all good calls. However, like most other valuation models, it didn’t signal the bear market that lasted from October 9, 2007 through March 9, 2009. At the end of 2008, the Rule of 20 was as bullish as it was in the early 1980s. That was another very good call. By early 2017, it was signaling that stocks were slightly overvalued for the first time since May 2002.
(3) Buffett ratio sees no bargains. Another valuation gauge I follow is the price-to-sales (P/S). The S&P 500 stock price index can be divided by forward revenues instead of forward earnings. However, the forward P/S ratio is very highly correlated with the forward P/E ratio. So it doesn’t add much to the assessment of valuation.
A variant of the P/S ratio is one that Warren Buffett said he favors. It is the ratio of the value of all stocks traded in the US to nominal GDP. The data for the numerator is included in the Fed’s quarterly Financial Accounts of the United States and lags behind the GDP report, which is available a couple of weeks after the end of a quarter on a preliminary basis. Needless to say, it isn’t exactly timely data.
However, the forward P/S ratio, which is available weekly, has been tracking Buffett’s ratio very closely. In an interview he did with Fortune in December 2001, Buffett said:
“For me, the message of that chart is this: If the percentage relationship falls to the 70% or 80% area, buying stocks is likely to work very well for you. If the ratio approaches 200%—as it did in 1999 and a part of 2000—you are playing with fire.”
That’s sage advice from the Sage of Omaha. His ratio was at 1.69 during Q4, while the P/S was 1.90 in mid-May, suggesting that we are playing with fire.
On the other hand, a year ago in a 5/2 CNBC interview, Buffett said:
“If you had zero interest rates and you knew you were going to have them forever, stocks should sell at, you know, 100 times earnings or 200 times earnings.”
He was speaking hypothetically, of course. More recently, this year in a 2/27 CNBC interview, Buffett said that US stock prices are “on the cheap side,” and added, “We are not in a bubble territory.” He also announced at the time that he had more than doubled his stake in Apple (NASDAQ:AAPL) since the new year and before the tech giant reported earnings on January 31.
(4) Fed model still bullish. To round out the discussion, I should mention that the Fed’s Stock Valuation Model showed that the S&P 500 was undervalued during April by 61.9% using the US Treasury 10-year bond yield and 24.9% using a corporate bond yield composite. This confirms Buffett’s assessment that stocks are relatively cheap compared to bonds. If more investors conclude that economic growth (with low unemployment) and inflation may remain subdued for a long while, then they should conclude that economic growth and inflation may remain historically low. That’s a Nirvana scenario for stocks, and would be consistent with valuation multiples remaining high.


