A successful investment process should seek to systematically take advantage of favorable risk/reward asymmetries over time. The value of that process should be revealed not by the performance of any individual stock, but through repetition with a portfolio of stock, and over a longer time horizon. As such, we are usually hesitant to write about individual stocks where we think the odds of outperformance or underperformance are fairly even.
It is the skew, or extent of potential outperformance or underperformance, around the odds of leading or lagging the market that we believe is crucial. A portfolio of stock with even odds of outperformance can be very powerful if the skew of those stocks is more limited in potential downside than upside. While quality is an obvious component to trying to limit downside risk in individual stock holdings, valuation is equally critical. Despite our hesitation to write about individual stocks, we think Tesla (NASDAQ:TSLA) offers an excellent example of an unfavorable risk/reward skew and one that is reminiscent of Cisco (NASDAQ:CSCO) just over two decades ago.
Tesla Currently Looks Similar To Cisco In 2020
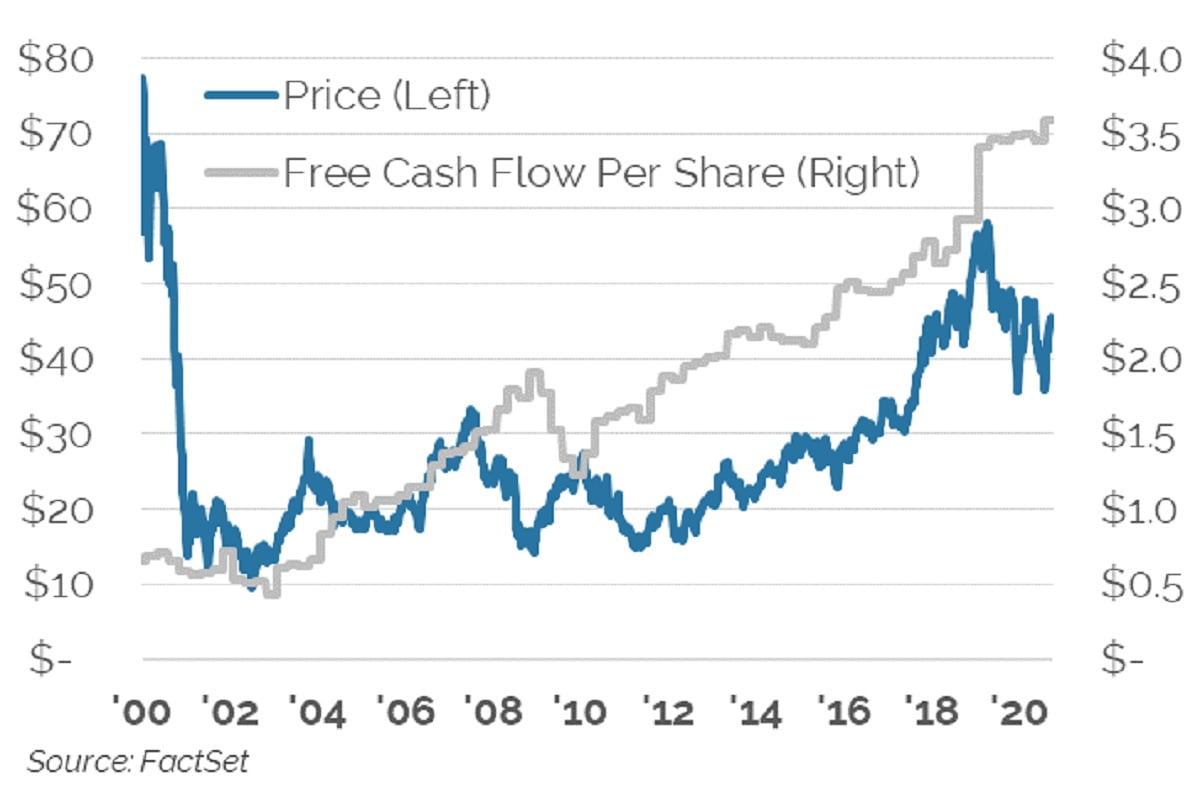
The stratospheric price performance, extreme valuation, and unfavorable risk/reward skew for Tesla at present looks remarkably similar to Cisco in 2000. In March of 2000, after a 1,300% price increase over the prior three years, Cisco’s weight in the S&P 500 hit 4%. Its stock price of $77 then was around 120x trailing twelve-month free cash flows and reflected enormous optimism about future growth prospects. This optimism was not unfounded as free cash flows increased 450% over the ensuing 20 years. But despite this growth, the stock remains more than 40% below its price in 2000 (See Figure 1.) The explanation for this disconnect between the stock price and its fundamentals is simple—the multiple paid for free cash flow contracted by 90%, providing a stunning example of the risk over overpaying for the shares of a good business.
Figure 1: Cisco Stock Price vs. Free Cash Flow

Cisco’s stock price is over 40% below its March 2000 level even though free cash flows have increased 450% since then.
Tesla today looks very much like Cisco in 2000. Tesla’s price is also up around 1,300% over the prior three years and is valued at roughly 300x forecast next-twelve-month free cash flows of $2.7B. Similar to Cisco in 2000, this valuation does not leave any cushion or downside protection and the risk of valuation compression over time will be a substantial obstacle for growth to overcome. While it is possible that Tesla’s fundamentals could surge from here (and do so even more so than Cisco’s over the prior 20 years), it seems less likely for them to exceed the incredible gains already discounted into the stock price.
Amazon's Fundamental Growth
To illustrate the challenge of embedded expectations, we can look at the fundamental growth achieved by Amazon from a similar starting point. In February of 2010, Amazon (NASDAQ:AMZN) was expected to earn roughly the same $2.7B of free cash over the next twelve months that Tesla is currently. In the decade since that time, Amazon’s free cash flow growth was staggering and increased around 13.5x for an annualized 30% growth rate. Amazon’s market value increased nearly 18x or an annualized 33% over the same period. The market value increase was able to outpace fundamental growth as the starting multiple of free cash flows of 19.3x in Feb ’10 increased to 25x a decade later—both very different than Tesla’s current 300x. Amazon’s free cash flow multiple has expanded even further to around 38x most recently. While the current multiple looks very expensive relative to the market multiple of 25x (which itself looks somewhat stretched), Tesla’s current valuation is an order of magnitude different from Amazon’s multiple both ten years ago and today.
The implications of this valuation gap between Amazon and Tesla are significant. If, for example, Tesla were to achieve the same extraordinary success as Amazon and grew free cash flow by 13.5x from its current $2.7B estimate and if Tesla traded at the same multiple Amazon did 10 years after doing the same, Tesla’s market value would only be 17% higher than it is today. Likewise, if we assume Tesla can match Amazon’s extraordinary growth for 10 years and then trade at Amazon’s current multiple of nearly 40x, Tesla’s market value will only increase by an annualized 5.6% per year. While this would not be a disastrous result, it does not offer significant upside for the stock even in an enormously optimistic growth scenario. Against this upside, the downside risk is potentially gigantic and the risk/reward skew looks very asymmetric.
While it is not unusual for certain stocks to periodically achieve rich valuations and highly unfavorable risk/reward skews, Tesla is somewhat unique in that it was added to the S&P 500 Index after its extraordinary rise and then moved substantial higher again on only the news of its inclusion. We doubt that many investors would be happy with an investment manager who announced to the world their intention to buy a substantial amount of a stock in several months’ time and then after the stock went up significantly on the news, bought that much more of it. Yet this is the path of the S&P 500 and all those who are simply invested in a passive vehicle mimicking it.
