
Vail Resorts, Inc. (NYSE:MTN) reported better-than-expected results in third-quarter fiscal 2019. Adjusted earnings of $7.12 per share beat the Zacks Consensus Estimate of $7.03 by 1.3%. Earnings also increased 15.4% from the year-ago quarter.
Quarterly revenues of $958 million surpassed the consensus mark of $956 million and increased 13.4% on a year-over-year basis.
Following the results, shares of the company gained as much as 5.7% in the after-hours trading. However, its shares have gained 3.5% so far this year, underperforming the industry’s 10.6% rally.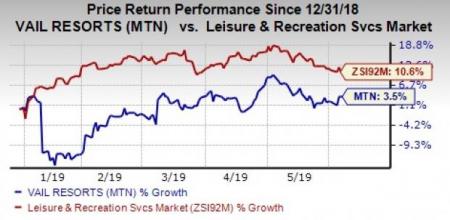
Total revenues were favored by growth in each segment. Also, the company’s season pass and large ski offerings drove incremental growth.
Segment Results
Vail Resorts generates revenue from two segments — Resort (99.9% of net revenues in third-quarter fiscal 2019) and Real Estate (0.03%). Under the Resort segment, the company has Mountain and Lodging services and other (constituting 83.6% of net revenues in the fiscal third quarter), and Mountain and Lodging retail and dining (16.4%).
Meanwhile, Vail Resorts has two reporting segments — Mountain (91.7% in third-quarter fiscal 2019) and Lodging (8.3%).
The Mountain segment reported revenues of $877.9 million in the quarter, up 13.6% year over year, mainly driven by higher sales from Triple Peaks and Stevens Pass, and increased lift, ski and rental revenues.
EBITDA increased 14.4% to $468.1 million from the prior-year quarter. Operating expenses at the Mountain segment totaled $410.3 million, up 12.7% year over year.
Lodging net revenues in the reported quarter were $79.8 million, up 16% year over year on an increase in hotel room and dining sales.
Under the segment, EBITDA increased 20.5% to $12.6 million from the prior-year quarter. Operating expenses at the Lodging segment rose 15.2% year over year to $67.2 million.
Operating Results
The company’s resort reported EBITDA was $480.7 million in the quarter under review compared with $419.7 million a year ago.
Resort operating expenses totaled $477.5 million, up 13.1% year over year. Total segmental operating expenses increased 13.6% year over year to $478.9 million.
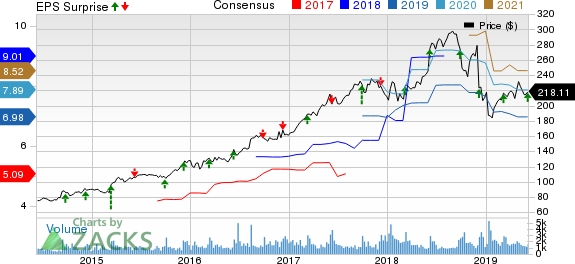
Vail Resorts, Inc. Price, Consensus and EPS Surprise
Balance Sheet
Cash and cash equivalents as of Apr 30, 2019, were $59.6 million. Net long-term debt as of Apr 30, 2019, was $1,299.7 million.
Vail Resorts approved a quarterly cash dividend of $1.76 per share of common stock, which will be payable on Jul 11, 2019, to shareholders of record as of Jun 26, 2019.
Fiscal 2019 Guidance
For fiscal 2019, the company’s resort EBIDTA is estimated at $702-$712 million, up from the previously announced $690-$710 million. Net income is projected to be $301-$317 million.
Zacks Rank & Stocks to Consider
Vail Resorts currently carries a Zacks Rank #3 (Hold). A few better-ranked stocks from the leisure space are Marcus Corporation (NYSE:MCS) , SeaWorld Entertainment (NYSE:SEAS) and Johnson Outdoors (NASDAQ:JOUT) . While Marcus Corporation and Johnson Outdoors currently sport a Zacks Rank #1 (Strong Buy), SeaWorld Entertainment has a Zacks Rank #2 (Buy). You can see the complete list of today’s Zacks #1 Rank stocks here.
SeaWorld Entertainment and Johnson Outdoors’ earnings for 2019 are expected to increase 169.2% and 1.5%, respectively. Marcus Corporation’s earnings for 2020 are expected to rise 20.7%.
More Stock News: This Is Bigger than the iPhone!
It could become the mother of all technological revolutions. Apple (NASDAQ:AAPL) sold a mere 1 billion iPhones in 10 years but a new breakthrough is expected to generate more than 27 billion devices in just 3 years, creating a $1.7 trillion market.
Zacks has just released a Special Report that spotlights this fast-emerging phenomenon and 6 tickers for taking advantage of it. If you don't buy now, you may kick yourself in 2020.
Click here for the 6 trades >>
Marcus Corporation (The) (MCS): Free Stock Analysis Report
Johnson Outdoors Inc. (JOUT): Free Stock Analysis Report
SeaWorld Entertainment, Inc. (SEAS): Free Stock Analysis Report
Vail Resorts, Inc. (MTN): Free Stock Analysis Report
Original post