Get 40% Off
🚨 Markets Are Down. Unlock Undervalued StocksFind Stocks Now

WTI, Canadian Dollar Reverse On Planned U.S.-Iran Meeting

Published 09/12/2019, 12:20 AM
Updated 07/09/2023, 06:31 AM

Yesterday, we discussed how the Canadian dollar could be in trouble if WTI crude were to make a false breakout of its daily triangle formation. Today, the false breakout was confirmed after Trump said he is making plans to meet with Iranian President Hassan Rouhani at a UN meeting later this month. A meeting between the two would be the first step towards easing sanctions on Iran and is generally considered to be negative for the price of crude.

The doji candle in WTI crude on a daily timeframe yesterday was a candle of indecision. Buyers tried to move price higher, however they were overcome by sellers who pushed the price back down to close unchanged on the day. Today, sellers continued to dominate and price moved back into the triangle, closing down almost 3.70%
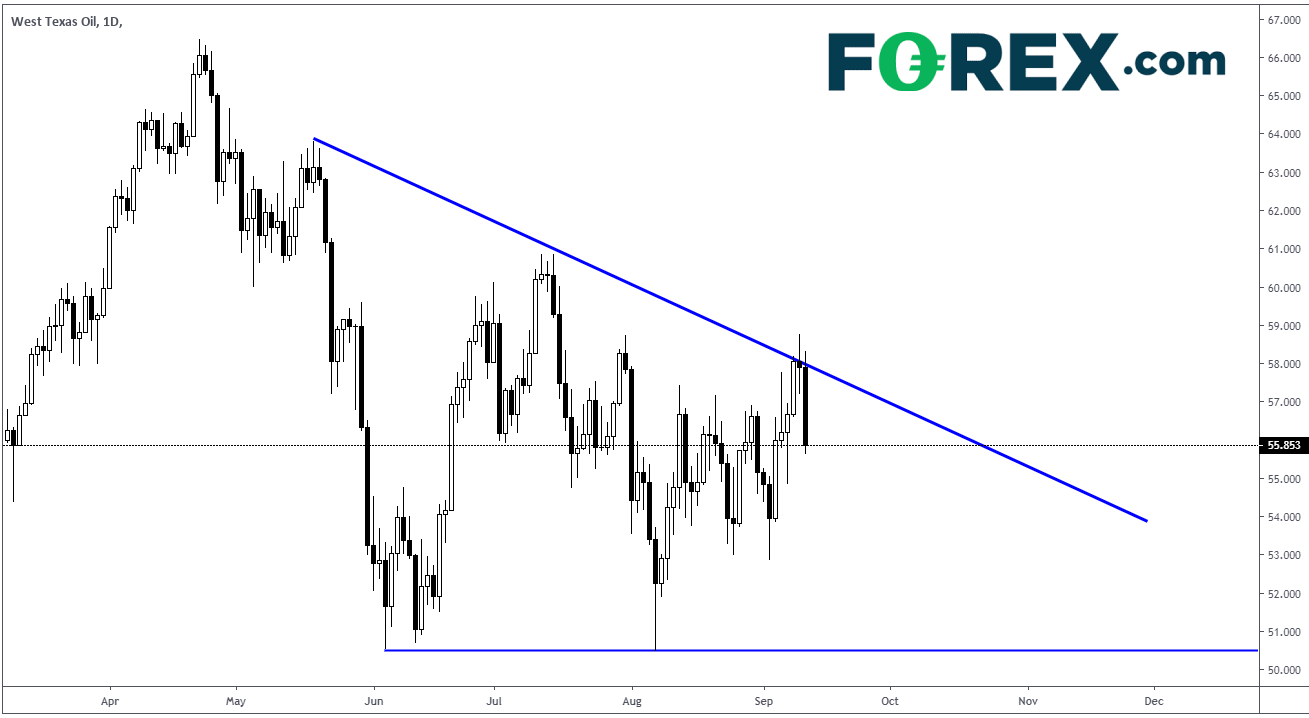
West Texas Oil Daily Chart

Source: All charts, Tradingview, FOREX.com

USD/CAD was hovering near the 61.8% retracement support level from the July 19th lows to the September 3rd highs, and with the move lower in crude, USD/CAD moved aggressively higher (CAD lower).
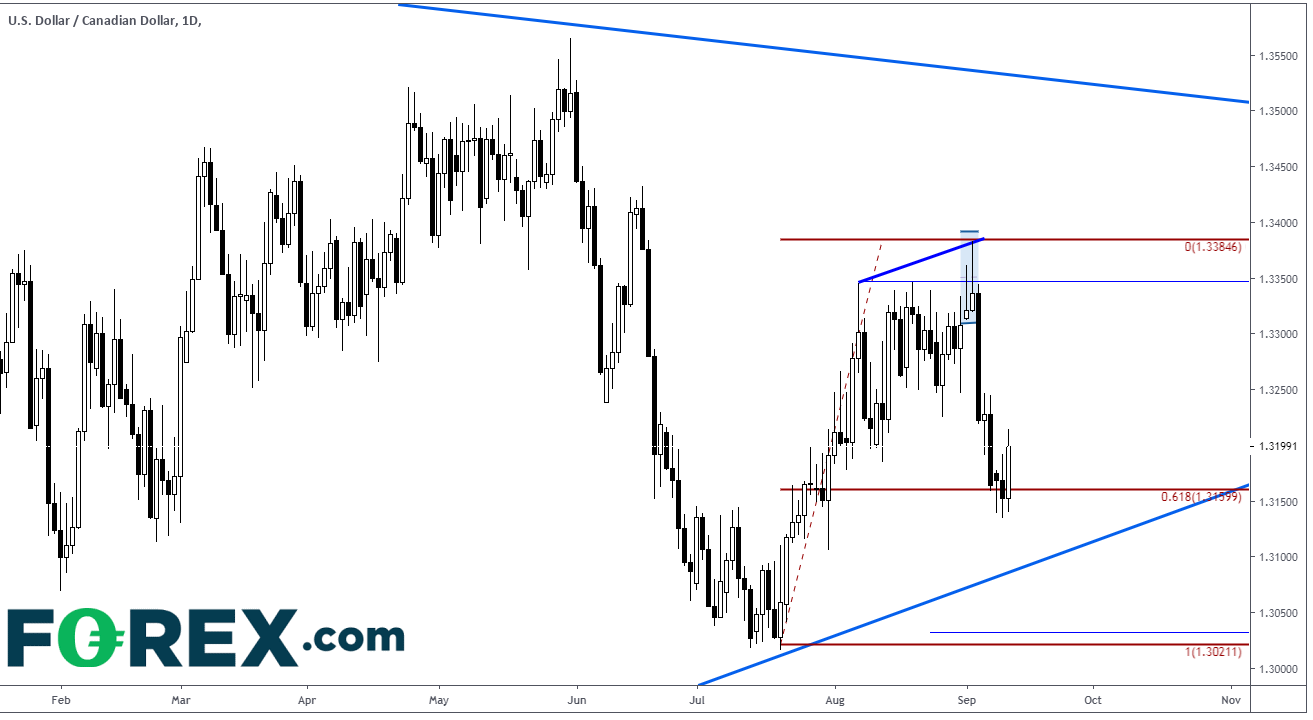
USD/CAD Daily Chart

To better illustrate how the two assets move together, below is a chart of WTI crude and Canadian dollar futures. Futures trade in the same direction as crude, as opposed to USD/CAD which trades inversely to crude. The correlation coefficient today is at +.64
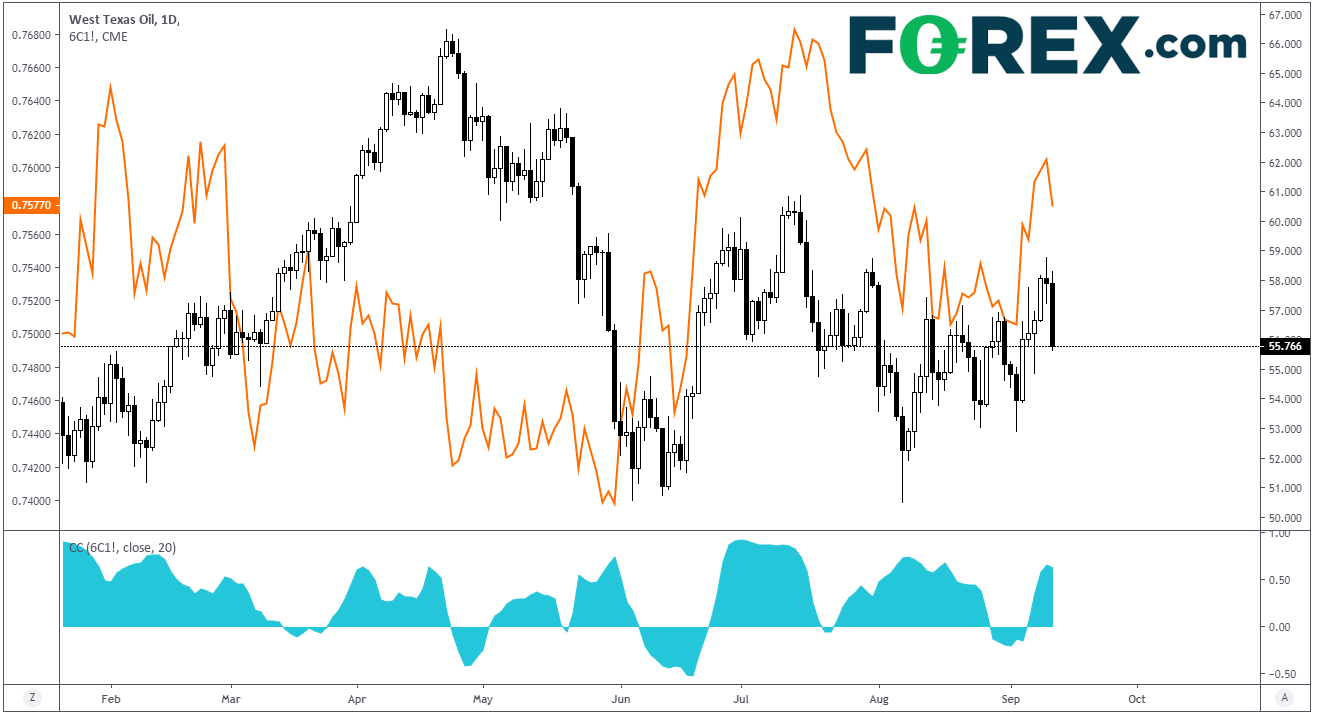
West Texas Oil Daily Chart

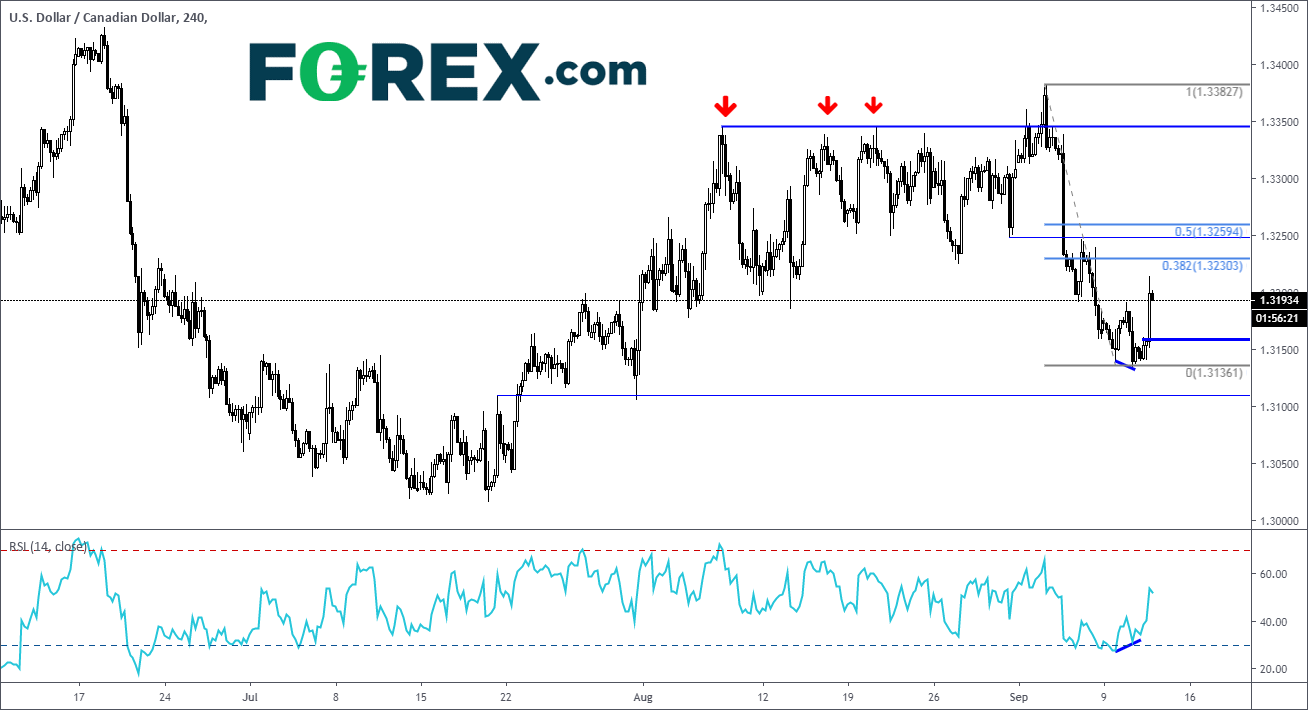
So yesterday we pondered, “What happens tomorrow if crude reverses its recent move higher and trades lower back into the triangle?" If that happened, the Canadian dollar may trade lower with it (USD/CAD higher). On a 240-minute USD/CAD chart, we noted the RSI was diverging with price, which is typically a signal of a potential reversal. This is indeed what happened as crude moved lower. USD/CAD traded to a high of 1.3214 and closed up 45 pips today at 1.3197. (The RSI is no longer oversold). Resistance levels remain the same as yesterday, horizontal resistance and Fibonacci retracements between 1.3230 and 1.3260. First support is now horizontal support at 1.3160. Below that support is near 1.3100.
3rd party Ad. Not an offer or recommendation by Investing.com. See disclosure here or remove ads .

USD/CAD 240 Chart

Latest comments

Risk Disclosure: Trading in financial instruments and/or cryptocurrencies involves high risks including the risk of losing some, or all, of your investment amount, and may not be suitable for all investors. Prices of cryptocurrencies are extremely volatile and may be affected by external factors such as financial, regulatory or political events. Trading on margin increases the financial risks.
Before deciding to trade in financial instrument or cryptocurrencies you should be fully informed of the risks and costs associated with trading the financial markets, carefully consider your investment objectives, level of experience, and risk appetite, and seek professional advice where needed.
Fusion Media would like to remind you that the data contained in this website is not necessarily real-time nor accurate. The data and prices on the website are not necessarily provided by any market or exchange, but may be provided by market makers, and so prices may not be accurate and may differ from the actual price at any given market, meaning prices are indicative and not appropriate for trading purposes. Fusion Media and any provider of the data contained in this website will not accept liability for any loss or damage as a result of your trading, or your reliance on the information contained within this website.
It is prohibited to use, store, reproduce, display, modify, transmit or distribute the data contained in this website without the explicit prior written permission of Fusion Media and/or the data provider. All intellectual property rights are reserved by the providers and/or the exchange providing the data contained in this website.
Fusion Media may be compensated by the advertisers that appear on the website, based on your interaction with the advertisements or advertisers.
© 2007-2024 - Fusion Media Limited. All Rights Reserved.