Get 40% Off
🚨 Volatile Markets? Find Hidden Gems for Serious OutperformanceFind Stocks Now

USD/JPY Unaffected By Terrible Japan GDP

Published 02/18/2020, 12:19 AM
Updated 07/09/2023, 06:31 AM

Yikes!!! The GDP data out of Japan yesterday was nothing short of awful. The Annualized Preliminary GDP Growth Rate for Q4 was -6.3% vs an expectation of -3.7% and 0.5% in Q3. Granted, Japan did introduce a new sales tax AND they had a devastating typhoon. However, those were already factored into the estimate of -3.7%!!!

But USD/JPY is immune to bad data from Japan, which has been fairly weak for the past couple decades (yes, decades). So, bad data is good data. Traders know that the government will be there to provide more stimulus if need be.

On another note, in addition to the bad GDP data concerns are growing about the coronavirus in Japan. Japan is shutting down large public events to prevent any contagion that may occur, including emperor’s birthday celebrations and the Tokyo Marathon (except to elite runners). Could this eventually feed through to GDP as it is in China???

USD/JPY barely even flinched on the data. On a 30-minute chart, price traded in a tight range upon the release, moving over the next half hour between 109.82 down to 109.72 and back.
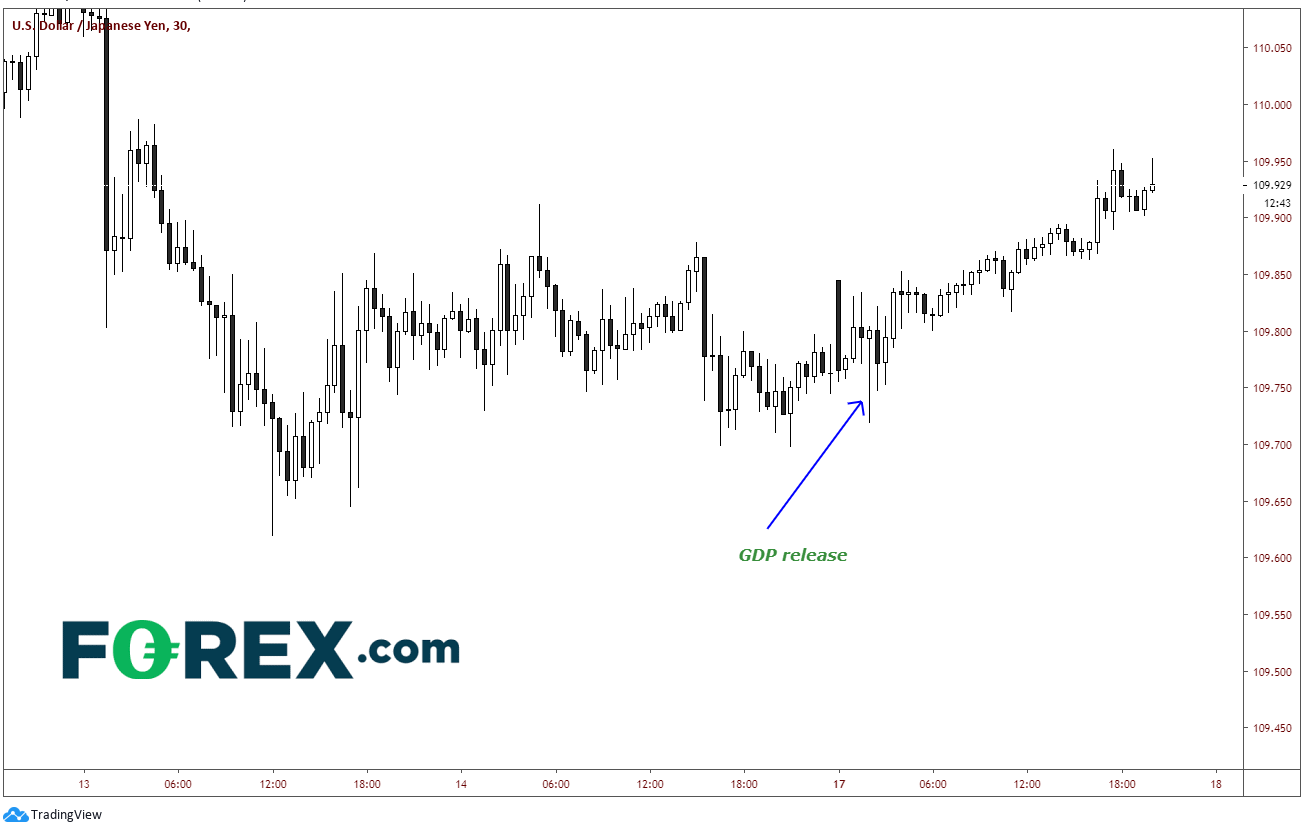
USD/JPY 30 Min Chart

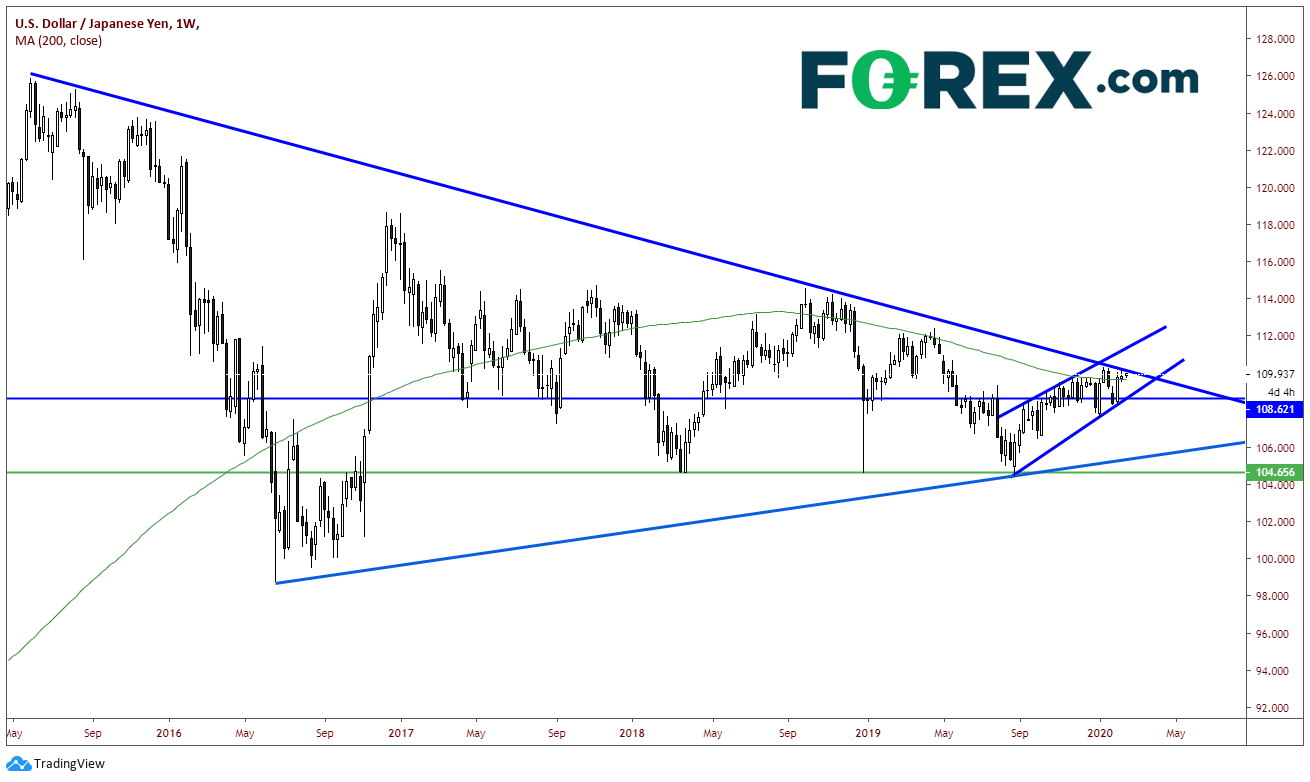
On a weekly timeframe, USD/JPY is trading within a symmetrical triangle, near the top of the downward sloping trendline. This trendline dates back to the first week of June 2015 and is just above the 200 Week Moving Average. If the pair closes above 110.30 on a weekly basis, it has immediate room to run to near 111.50.
3rd party Ad. Not an offer or recommendation by Investing.com. See disclosure here or remove ads .
USD/JPY Weekly Chart

On a daily timeframe, we get a better look of how close USD/JPY is to the downward sloping long-term trendline, as well as previous highs at 110.30. There is strong support below at a confluence of supports near 108.30/50. Near this level is the upward sloping trendline from the August 23rd, 2019 lows, the 200 Day Moving Average and previous lows from February 3rd.
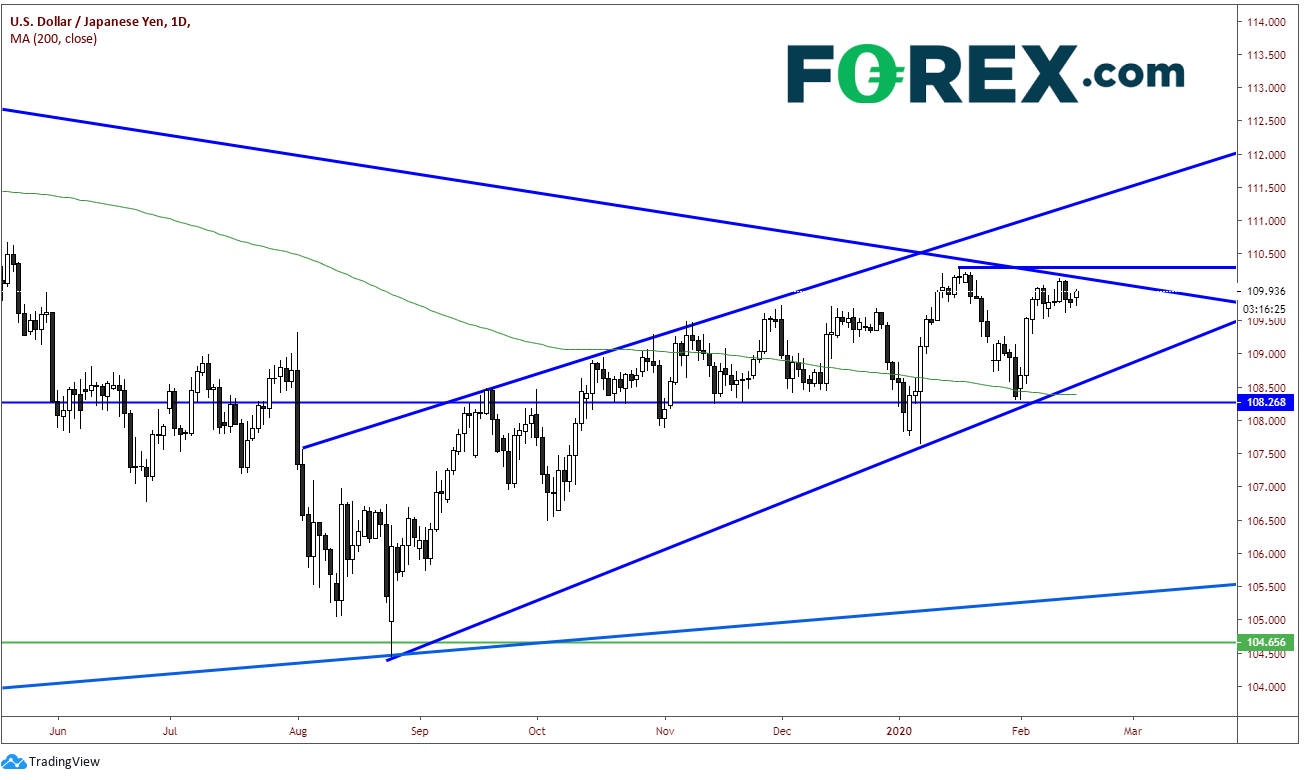
USD/JPY Daily Chart

As USD/JPY approaches the apex of the long-term symmetrical triangle on the weekly chart, watch for a breakout above 110.30. There will likely need to be a catalyst to get the pair moving to the upside. However, one thing that seems unlikely to be the catalyst for a move is Japan’s economic data!

Original Post

Latest comments

Risk Disclosure: Trading in financial instruments and/or cryptocurrencies involves high risks including the risk of losing some, or all, of your investment amount, and may not be suitable for all investors. Prices of cryptocurrencies are extremely volatile and may be affected by external factors such as financial, regulatory or political events. Trading on margin increases the financial risks.
Before deciding to trade in financial instrument or cryptocurrencies you should be fully informed of the risks and costs associated with trading the financial markets, carefully consider your investment objectives, level of experience, and risk appetite, and seek professional advice where needed.
Fusion Media would like to remind you that the data contained in this website is not necessarily real-time nor accurate. The data and prices on the website are not necessarily provided by any market or exchange, but may be provided by market makers, and so prices may not be accurate and may differ from the actual price at any given market, meaning prices are indicative and not appropriate for trading purposes. Fusion Media and any provider of the data contained in this website will not accept liability for any loss or damage as a result of your trading, or your reliance on the information contained within this website.
It is prohibited to use, store, reproduce, display, modify, transmit or distribute the data contained in this website without the explicit prior written permission of Fusion Media and/or the data provider. All intellectual property rights are reserved by the providers and/or the exchange providing the data contained in this website.
Fusion Media may be compensated by the advertisers that appear on the website, based on your interaction with the advertisements or advertisers.
© 2007-2024 - Fusion Media Limited. All Rights Reserved.