
USD/JPY has been in a sliding mode since Wednesday, when it once again hit resistance near the 111.60 barrier. Yesterday, the rate slid below the short-term uptrend line taken from the low of March 9th, and then, below the psychological round figure of 110.00. Thus, having all these technical signs in mind, we would consider the short-term outlook to be cautiously negative.
Today, the rate hit support near 108.20 and rebounded somewhat, which suggests that some further recovery may be on the cards before the next leg south, perhaps for a test near the 109.60 hurdle. If the bears decide to take charge from there, then we may see them aiming for the 108.20 support again, which if broken may allow declines towards the 106.80 obstacle, marked by the low of March 18th. Another break, below 106.80, may carry more bearish implications, perhaps paving the way towards the 105.60 territory.
Taking a look at our short-term oscillators, we see that the RSI rebounded from slightly above the 30 mark, while the MACD, although below both its zero and trigger lines, shows signs that it could start bottoming soon. Both indicators detect slowing downside speed, supporting the idea of some further recovery before, and if, the bears decide to shoot again.
In order to abandon the bearish case, we would like to see a strong recovery above the 110.00 psychological zone. This may encourage some bulls to drive the battle towards the 111.60 area, which provided strong resistance between March 20th and 25th, or the 112.20 barrier, defined by the highs of February 19th and 20th. That said, before we start examining the resumption of the latest short-term uptrend, we would like to see a strong break above 112.20. Such a move may extend the advance towards the 113.50 hurdle, near the peak of December 17th.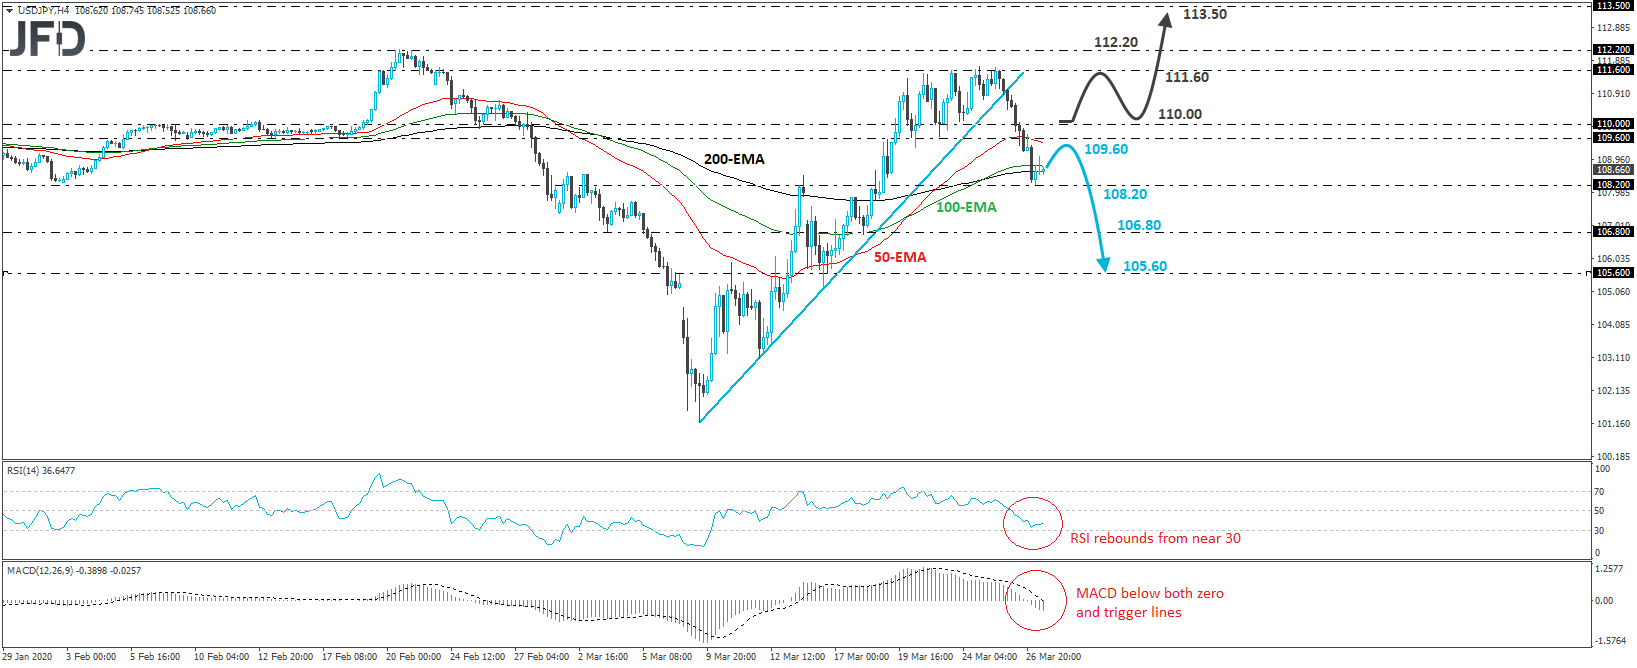
- English (UK)
- English (India)
- English (Canada)
- English (Australia)
- English (South Africa)
- English (Philippines)
- English (Nigeria)
- Deutsch
- Español (España)
- Español (México)
- Français
- Italiano
- Nederlands
- Português (Portugal)
- Polski
- Português (Brasil)
- Русский
- Türkçe
- العربية
- Ελληνικά
- Svenska
- Suomi
- עברית
- 日本語
- 한국어
- 简体中文
- 繁體中文
- Bahasa Indonesia
- Bahasa Melayu
- ไทย
- Tiếng Việt
- हिंदी
USD/JPY Trades Below The 110.00 Barrier
Published 03/27/2020, 08:30 AM
Updated 07/09/2023, 06:31 AM
USD/JPY Trades Below The 110.00 Barrier
Latest comments
Install Our App
Risk Disclosure: Trading in financial instruments and/or cryptocurrencies involves high risks including the risk of losing some, or all, of your investment amount, and may not be suitable for all investors. Prices of cryptocurrencies are extremely volatile and may be affected by external factors such as financial, regulatory or political events. Trading on margin increases the financial risks.
Before deciding to trade in financial instrument or cryptocurrencies you should be fully informed of the risks and costs associated with trading the financial markets, carefully consider your investment objectives, level of experience, and risk appetite, and seek professional advice where needed.
Fusion Media would like to remind you that the data contained in this website is not necessarily real-time nor accurate. The data and prices on the website are not necessarily provided by any market or exchange, but may be provided by market makers, and so prices may not be accurate and may differ from the actual price at any given market, meaning prices are indicative and not appropriate for trading purposes. Fusion Media and any provider of the data contained in this website will not accept liability for any loss or damage as a result of your trading, or your reliance on the information contained within this website.
It is prohibited to use, store, reproduce, display, modify, transmit or distribute the data contained in this website without the explicit prior written permission of Fusion Media and/or the data provider. All intellectual property rights are reserved by the providers and/or the exchange providing the data contained in this website.
Fusion Media may be compensated by the advertisers that appear on the website, based on your interaction with the advertisements or advertisers.
© 2007-2024 - Fusion Media Limited. All Rights Reserved.