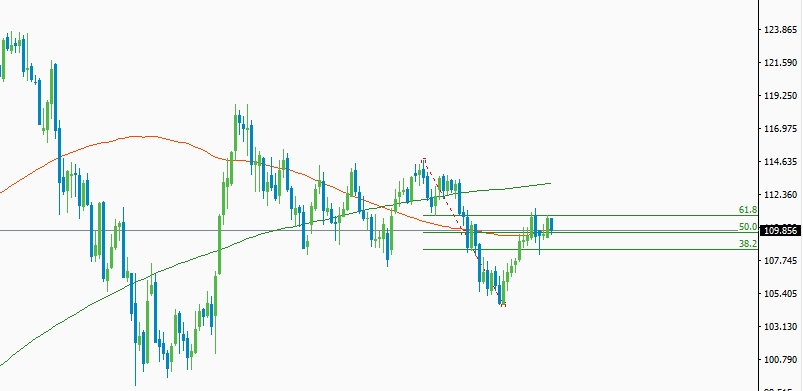
After the strong extended bearish rally, the USD/JPY pair has found some decent support at 98.87. From that level, the pair started its bullish rally and found some strong resistance at 118.52. From that level, the pair against started its bearish rally but it was contained by the critical support level at 104.54. From that level, the buyers again take control of this market and started its final bullish correction. Currently, the price is testing the 61.8% bearish retracement level drawn from the high of 5th November 2017 to the low of first April 2018.
USD/JPY daily chart analysis 
Figure: USDJPY testing 61.8% bearish retracement level
From the above figure, you can clearly see the sellers are slowly losing control of this market but still they need to clear out the critical resistance level at 110.83 to establish medium-term bottom near the critical support level at 104.54. According to the leading analyst of Rakuten broker, a daily closing of the price above the 61.8% bearish retracement level will turn the initial bias of this pair bullish.
If the current resistance level manages to refuel the bears, the pair is most likely to drop towards the next support level at 104.54. From that level, we might see some decent bullish bounce and any bullish price action confirmation signal will be an excellent opportunity to execute long orders. A daily closing of the price below the low of 18th March 2018 will turn the initial bias of this pair strongly bearish. This will eventually lead this pair towards the next major support level at 98.94. This level is going to extremely supportive for the dollar bulls and sellers will have a tough time to clear out this resistance level. From that level, the optimistic buyers will be looking to execute long orders but buying the pair at such lower price will be an immature act in the absence of definite bullish reversal sign.
On the upside, we need to break above the 61.8% retracement level to establish strong bullish momentum in this pair. A clear break of the critical resistance level at 110.90 will eventually lead this pair towards the next critical resistance level at 111.42. This level is going to provide an extreme level of selling pressure to this pair and most of the leading price action traders will be looking for bearish price action confirmation signal to execute short orders. A strong retreat from that level will again lead this pair towards the broken 61.8% retracement level. On the contrary, a clear break of that resistance level will eventually lead this pair towards the major resistance level at 114.64. Clearing out this critical resistance level will be extremely hard since we have plenty of resistance candle just above this level. However, a clear break of this level will confirm the end of a medium-term bearish trend.
Fundamentally the recent performance of the U.S economy is doing relatively well and most of the leading investors are expecting a strong surge in the U.S dollar index. In the last trading week, the FED has hiked their interest rate on the basis of 25 points and FED Chairperson Jerome Powel has also stated they will go for another rate hike if their economy manages to overcome the current recession problem. However, some of the leading economists are considering such frequent rate hike as an aggressive act to stabilize their economy. But such drastic action from the FED officials might prolong the recession problem due to the rise of the inflation rate. Moreover, the average hourly income of the U.S economy is facing exponential growth which strongly suggests, green bucks are gaining back its former strength. Considering the technical and fundamental parameters, the USD/JPY bulls might clear out the current resistance level and establish an extended bullish rally.