Get 40% Off
🚨 Volatile Markets? Find Hidden Gems for Serious OutperformanceFind Stocks Now

USD/JPY: More Room To Run?

Published 09/23/2018, 05:24 PM

Japan's economy was revitalizing in the 2nd quarter on the back of the stronger consumer spending and received an optimistic projection for the 3rd quarter. The yen rebounded from a ~105.000 low in March to a ~113.000 high in July and is currently in an uptrend on the daily chart. And despite BoJ effort to bring inflation to 2%, it remains at historical lows.

A close look onto price action in the months of July and August will reveal how price broke out of the weekly bearish resistance trendline (orange on the chart) to rally towards the 113.000 area twice. The new trend is on a 31 degrees angle and offers plenty of room for price to float onto. The nearest horizontal resistance and perhaps bulls first TP is ~114.000.

The last daily candle, however, did not close in favor of the buyers. It reached one of the two mid-trendlines and shaped into a shooting star by the end of the day. The PA could, therefore, go bearish again making a new higher low onto the lower limit of the channel. The intent is for it not to bottom lower than ~111.000 in the next two weeks so as to not create an uncertain prospect for traders.

In addition, Stoch has been in the overbought zone for the last 10 days but no divergence is in sight for now (daily chart). Perhaps, a reset is needed on lower TFs to push the price higher later on.

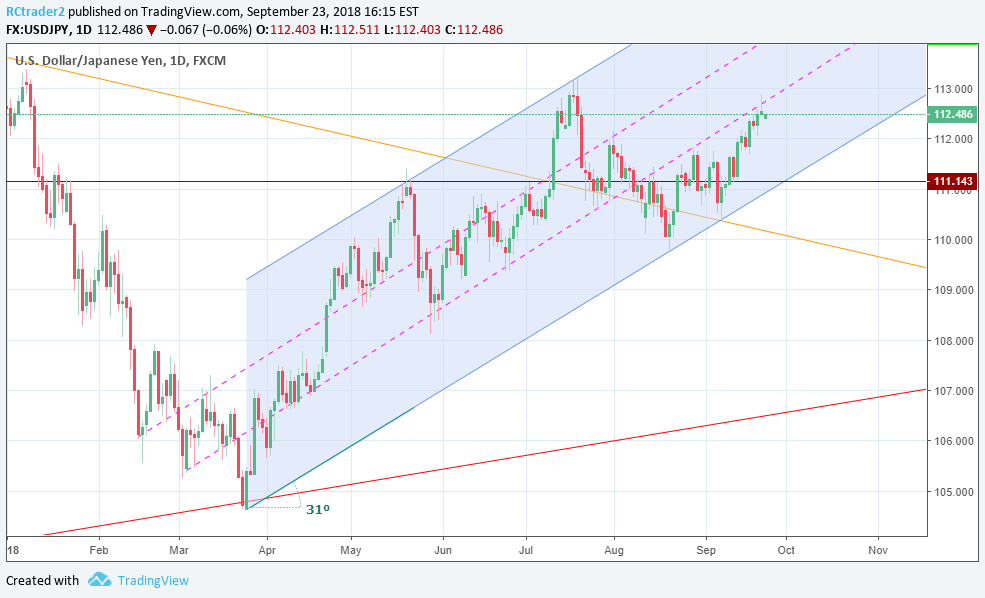
USDJPY Harvest, September 24, 2018

Latest comments

Risk Disclosure: Trading in financial instruments and/or cryptocurrencies involves high risks including the risk of losing some, or all, of your investment amount, and may not be suitable for all investors. Prices of cryptocurrencies are extremely volatile and may be affected by external factors such as financial, regulatory or political events. Trading on margin increases the financial risks.
Before deciding to trade in financial instrument or cryptocurrencies you should be fully informed of the risks and costs associated with trading the financial markets, carefully consider your investment objectives, level of experience, and risk appetite, and seek professional advice where needed.
Fusion Media would like to remind you that the data contained in this website is not necessarily real-time nor accurate. The data and prices on the website are not necessarily provided by any market or exchange, but may be provided by market makers, and so prices may not be accurate and may differ from the actual price at any given market, meaning prices are indicative and not appropriate for trading purposes. Fusion Media and any provider of the data contained in this website will not accept liability for any loss or damage as a result of your trading, or your reliance on the information contained within this website.
It is prohibited to use, store, reproduce, display, modify, transmit or distribute the data contained in this website without the explicit prior written permission of Fusion Media and/or the data provider. All intellectual property rights are reserved by the providers and/or the exchange providing the data contained in this website.
Fusion Media may be compensated by the advertisers that appear on the website, based on your interaction with the advertisements or advertisers.
© 2007-2024 - Fusion Media Limited. All Rights Reserved.