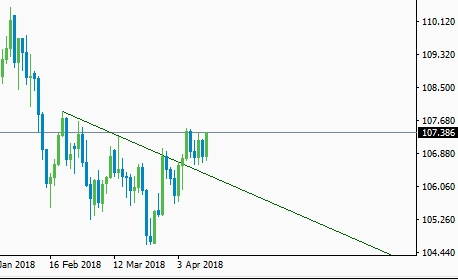
Finally, the ranging movement of the USD/JPY pair has come to an end after it breaks the bearish trend line resistance at 106.57. Prior to the breach of this critical resistance level, the sellers have done a great job in keeping this pair below the 107.00 mark. Currently, the pair is slowly heading towards the next major resistance level at 107.50.From that level, we might again experience some ranging movements in the market. A daily closing of the price above the critical resistance level at 107.50 will ultimately lead this pair towards the next resistance level at 108.27.
Breaking Bearish Trend-Line Resistance

From the above figure, you can clearly see that the bulls have taken control over the market after it breached the major resistance level at 106.57.The long-term investors of Juno market are expecting a strong recovery attempt from the dollar bulls against the low Yielding Japanese Yen. Currently, the major resistance level at 108.27 is the biggest challenge for the bulls. A daily closing of the price above that critical resistance level will refuel the dollar bulls in the global market. This will eventually lead this pair towards the next major resistance level at 110.41.Moreover, we have an inverse head and shoulder pattern formed at the daily chart which gives the dollar bulls a strong chance to rally higher from a technical perspective.
On the downside, we need to break the broken trend line resistance to turn the current bias from bullish to neutral. However, most of the conservative traders will be looking to execute long orders near the broken trend line support level. The position traders have already gone long in the USD/JPY pair since BoJ has already stated further easing is a requirement for the development of Japanese economy.
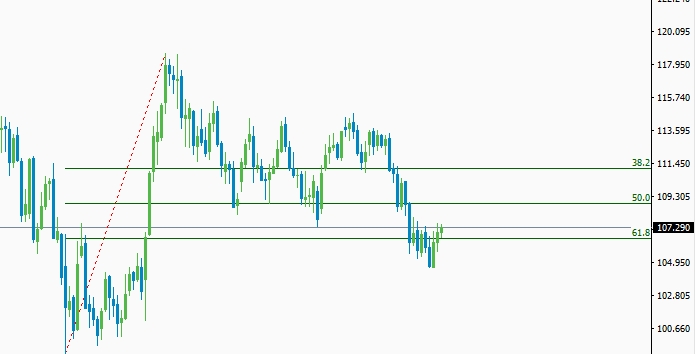
USD/JPY Trading Over 61.8% Retracement Level

In the weekly chart, the overall bias for the USD/JPY pair remains bullish. Though we had an initial break of the 61.8% retracement level, the recent turnaround clearly represents the new low at 104.60 as a false break. Currently, the bulls are trying reach to test the 50 bullish retracement level at 109.20.From that level, we might see some selling pressure but a weekly closing of the price above 109.20 will ultimately lead this pair towards the 38.2% bullish retracement level. This level will level will provide extensive selling pressure to the USD/JPY pair and the bulls will have a tough time to breach that level.
However, a clear break of that level in the daily chart will confirm the end of bearish correction in the USD/JPY pair. If the pair manages to close above the 111.45 level we will see a strong surge towards the high of 5th November 2017.This level is very crucial for the long-term investors since the sellers will be looking for clear sell setup to execute short orders. But a clear break of the critical resistance level at 111.45 will change the market sentiment strongly bullish.
The recent performance of the U.S economy is not up to the market but in the last FOMC week, FED officials have stated they have a clear plan to end the unemployment problem. Hopefully, more jobs will be added to the U.S economy in the next phase which will eventually help the dollar index to surge higher. The U.S dollar index which measures the overall value of the green buck’s strength is currently found some solid support near the 88.60 zone. This strong boost in the U.S dollar index is most likely to push U.S dollar index higher in the global market. Considering the daily and weekly chart analysis, it’s better to look for long trade setup.