We are now just hours away from September’s FOMC meeting, where traders are hungry for details on balance-sheet reduction and clues to the next hike’s timing. Anything short of this being delivered (particularly on the balance-sheet front) could result in disgruntled USD bulls tossing their dollars aside in disgust once more.
While the odds of a hike today are literally close to zero, it is the line-up of potentially volatile mini events that can give FOMC meetings such a buzz. Minor revisions to staff economic projections, dot plots or statements are enough to make global markets jolt around the US dollar. And then we also have the press conference, which can prompt volatility from just a couple of words, whether intended or simply a slip of the tongue.

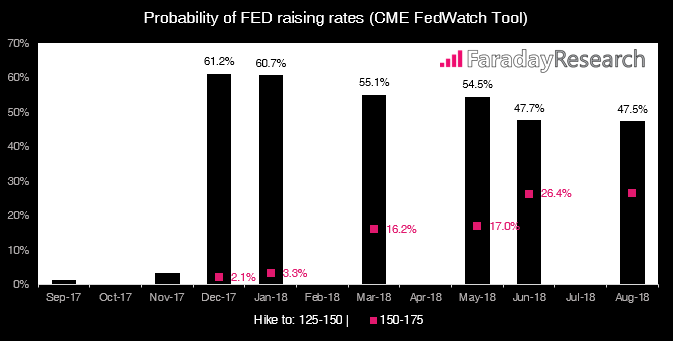
According to CME’s FedWatch tool on Tuesday, markets were pricing in a 61.2% probability of a hike in December. While this is still far from being a ‘dead cert,’ it has managed to crawl from the depths of 30%-40% over the last couple of weeks. Yet if the statement or press conference provide no timing clues, or staff projections are lowered, we’d expect to see the probabilities move lower with more pressure on the US dollar.
Due to the complex nature of the FOMC meeting, USD crosses are on the backburner until either the hype dies down or the technical picture becomes clearer. Add to the mix the BoJ meeting within 12 hours of Yellen’s press conference, and JPY crosses find themselves on the backburner too. Despite this, USD/JPY shows potential to return to the watchlist if it ticks our technical criteria following said events.

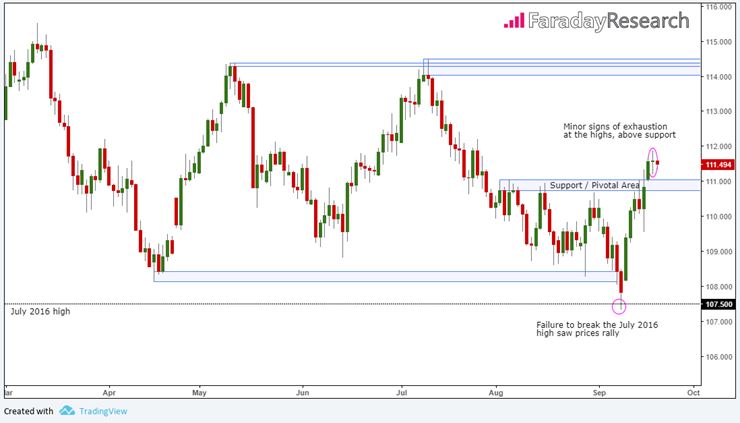
Less than two weeks ago, USD/JPY appeared set to break beneath the April low after bearish momentum picked at a key support zone. This had 108.13-108.43 marked as potential resistance and key structural point for potential bearish setups. Yet the quick recovery and subsequent rally above this zone placed USD/JPY within the centre of a wider range of 108-114, which leaves us questioning if it can extend gains from here. A key area we’ll be focusing on is its ability to hold above 110.74-111.05, making it pivotal area of interest.
If the events of the next 24hrs present a break to new highs for USD/JPY, it becomes a serious contender for long positions. Yet as price action has shown signs of exhaustion with a Rickshaw Man Doji, the potential for a retracement lower is also present. So, before considering long positions under this scenario, we’d want to see evidence of compression on the daily timeframe whilst also remaining above the key zone of support.
If a bearish outcome is to unfold and prices collapse below the support zone, USD/JPY will likely remain on the backburner once more until the daily trend becomes clearer.
