
The U.S. dollar has been catapulted to new highs for the month, even if the reinvigorated rally is far from enjoying a positive backdrop if we look at U.S. government yields. The micro and macro flow through U.S. fixed income portray a much uglier picture not backing the USD strength story. It is clear that the market has temporarily decoupled from treating the U.S. dollar (DXY) as a by-product of a country’s attractiveness, or lack thereof, towards its deteriorating sovereign bond yields. As I mentioned in twitter today:
If you pay attention to the latest movements in G6 FX bond yields, you will notice that there is just simply no better place to hide fundamentally speaking, which may help to understand why the latest dynamics in currency flows keep supporting the U.S. dollar even as U.S. yields drop and equities hold steady.
Narrative In Financial Markets
The deteriorating Australian economic data left the RBA Governor boxed in with no choice but to cave in, following in lockstep the moves by other Central Banks (Fed, ECB) by acknowledging that the next rate decision is ‘evenly balanced’, which in layman’s terms means that the RBA is increasingly shifting its focus towards a potential rate cut. The Aussie was absolutely smoked on the rather ‘off-the-cuff’ comments as the 2x ATR decline suggests.
The Kiwi was trounced on a double-whammy, including the piggy-backing effect against the Australian Dollar, alongside a poor employment report, where a substantial miss on the jobless rate, lower participation and the headline employment change weighted on the Kiwi. On the bright side for the Kiwi, even if not reflected in the price action, was the latest GDT dairy auction, which produced a winning bid of +6.7% which may result in Fonterra lifting its estimated payout for the current season and a marginal positive for the NZD.
U.S. trade balance came not as bad as expected at first sight (-$49.3b vs -54b expected), but once you scope out the details, the drop in exports/imports is worrisome, as is the severe downtrend in the data series, especially if one excludes petroleum.
The U.K. is stuck in a political mess with no easy way out for PM May, with the chances of either a new election or her resignation a distinct possibility. Donald Tusk, the President of the European Council, had some harsh wording to share, noting “I’ve been wondering what that special place in hell looks like for those who promoted Brexit without even a sketch of a plan how to carry it out safely”. It doesn’t sound like the most constructive tone and certainly portrays how EU politicians are willing to give 0 concessions.
For those betting about an eventual U.S. — China trade deal before March 1st deadline time, one that goes far beyond buying soybeans, be reminded that as Daniel Rose, Rhodium Group Partner and former senior advisor for international economic policy with the National Economic Council and the National Security Council, said to CNBC that “a real deal on U.S.-China trade will require “grueling changes” on China’s part, and there’s not much evidence that China’s leaders are willing to take that on.” That’s the cruel reality right now
Do you need further evidence on the dire economic situation in Germany? Wednesday’s December factory orders at -1.6% vs +0.3% exp or the January construction PMI at 50.7 vs 53.3 further strengthen the notion that the engine of growth in Europe is facing some tough headwinds.
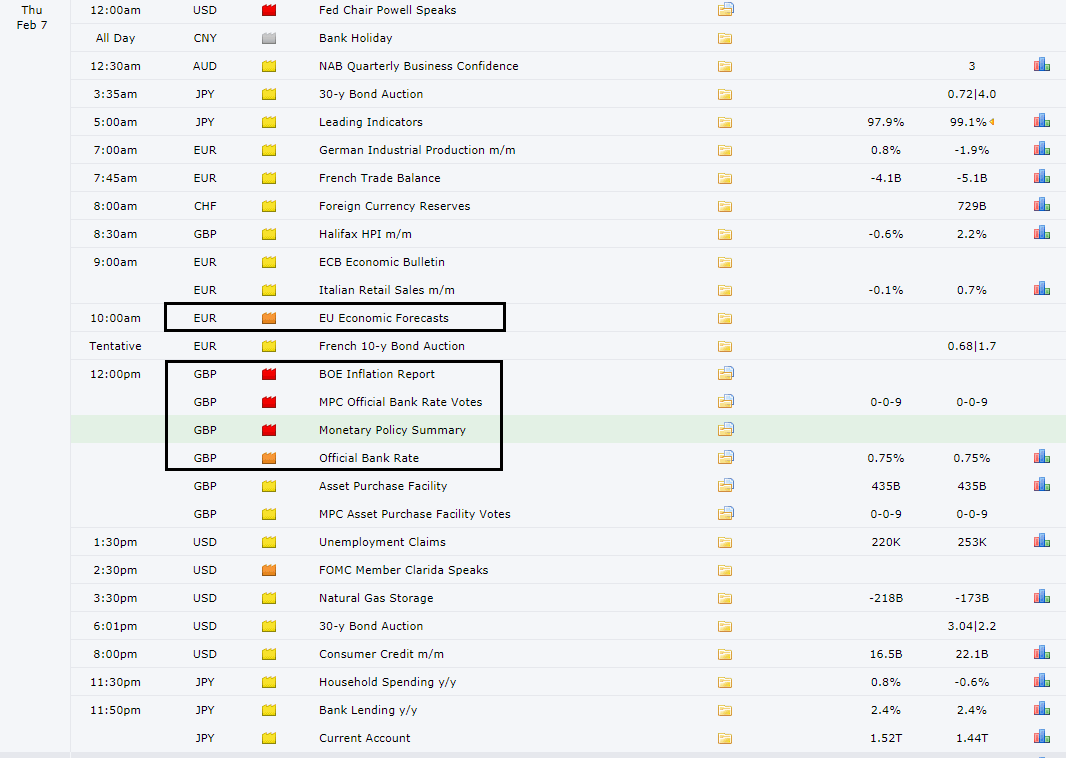
Potential Drivers Ahead — Economic Calendar
The EU Economic Forecasts report, even if it just serves as further anecdotal evidence, it should highlight the headwinds faced by the EU. Note, these are forecasts for EU member-states for the next 2 years and will provide further light on the negative trends in several EU member states.
The Bank of England will resort to a wait-and-see mode when it meets today. Its policy remains highly dependable to Brexit with the Bank of England likely to emphasize the risks of a hard Brexit.
As James Smith, Economist at ING notes, “deteriorating economic data and increasing political uncertainty means we’re unlikely to get a Bank of England rate hike any time soon — although the recent strength in wage growth means a move later in 2019 shouldn’t be completely ruled out.”
In the Brexit front, U.K. PM May is scheduled to meet EU’s Juncker in an encounter with the bar set very low in terms of hopes for any concessions that the U.K. may obtain from the EU. Watch for headlines from key policy-makers, although at this stage, the rhetoric has clearly shifted to a hard-line stance respecting the terms and conditions of the agreed U.K.-EU divorce deal.
RORO Model: Risk-On Risk-Off Conditions
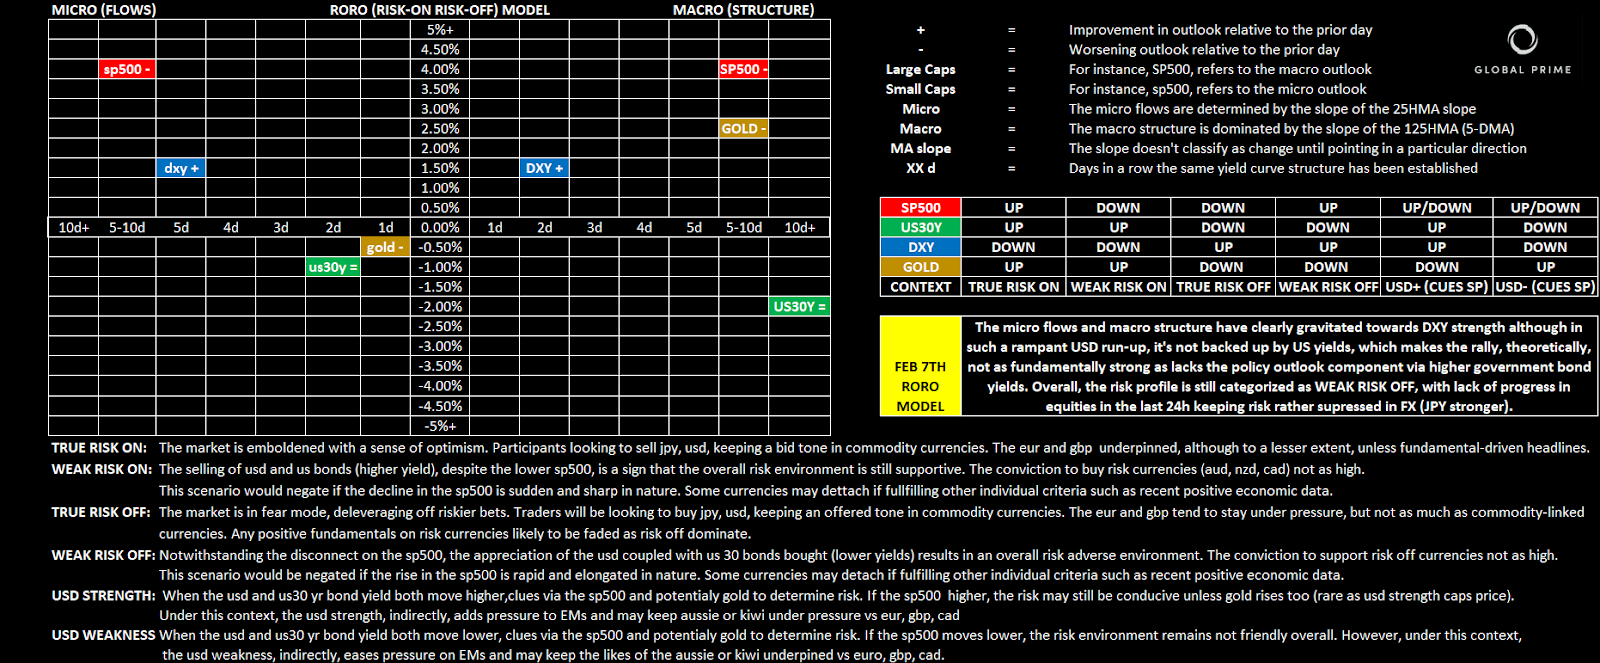
The microflows and macrostructure have clearly gravitated towards an isolated DXY strength. However, such a rampant USD run-up is not backed up by U.S. yields, which makes the rally, theoretically, not as fundamentally strong as it lacks the policy outlook component via higher government bond yields. Overall, the risk profile is still categorized as ‘weak risk off’ in both flows and structures. The lack of progress in equities in the last 24h is keeping risk rather suppressed in the Forex market, which should promote a stronger JPY unless equities resume the move up with vigor.
Yield Curve: Outlook For Growth, Inflation And Policies
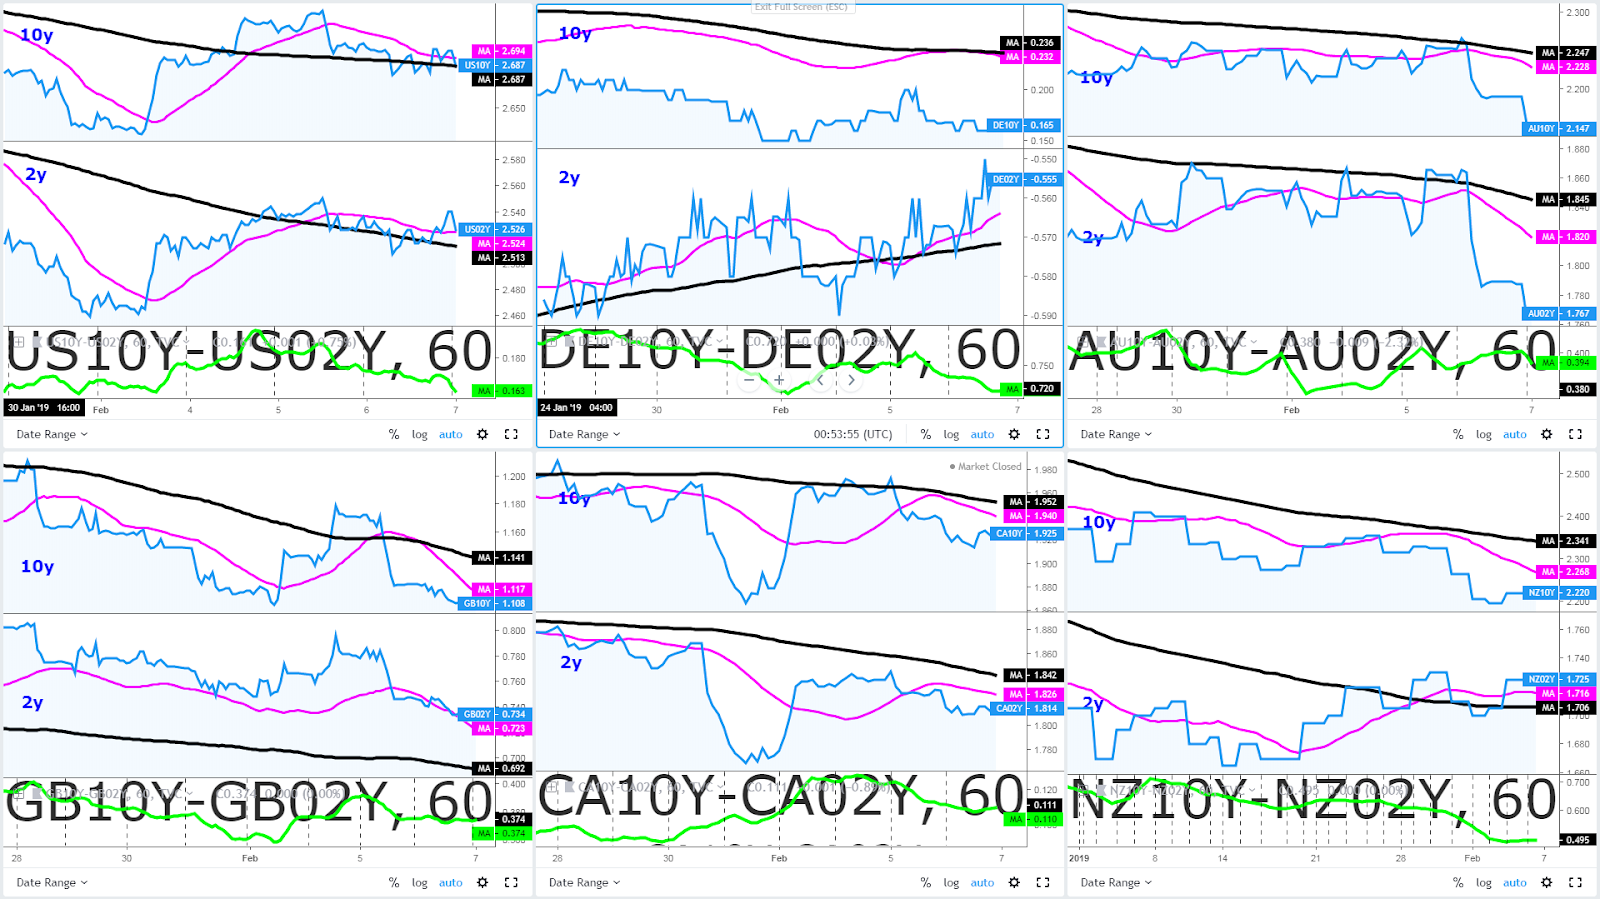
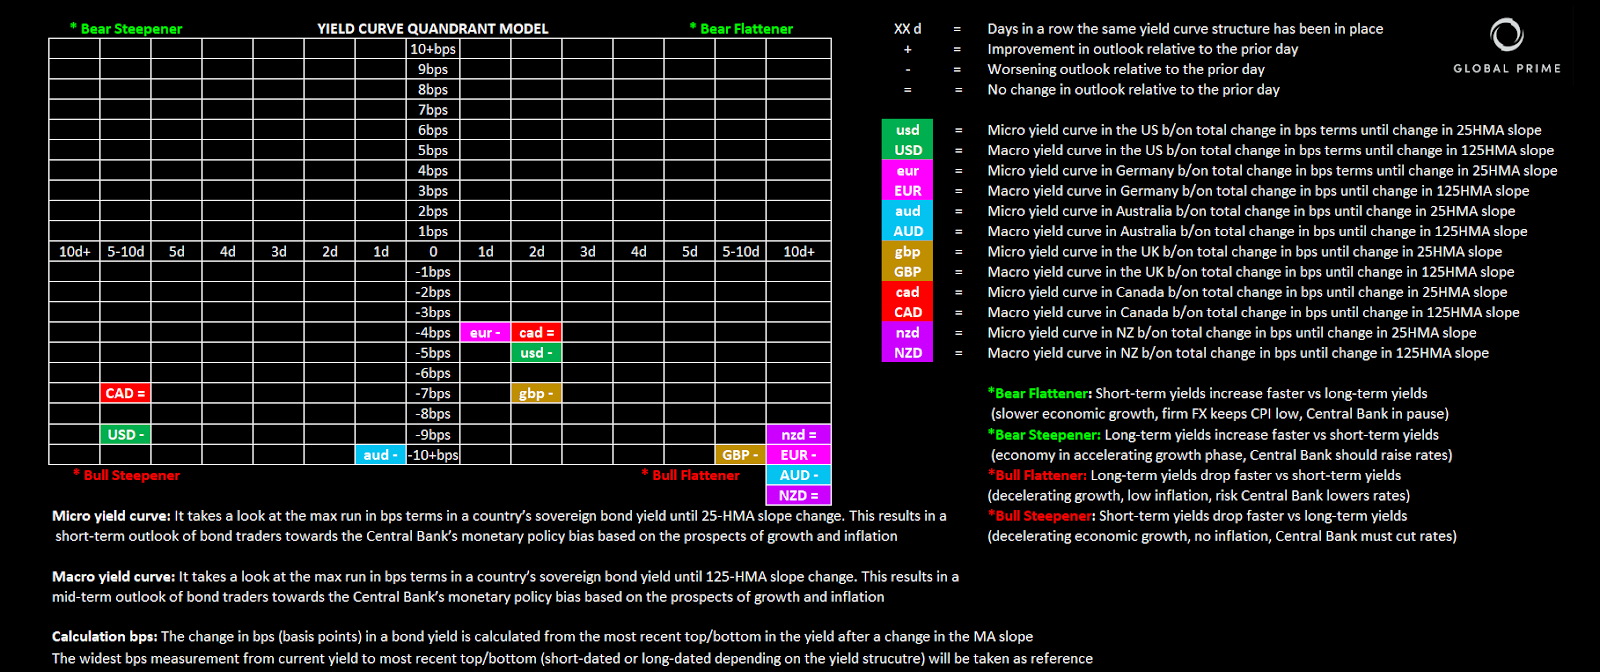
Just plain ugly the hints sent by bond vigilantes out there. Macro-wise, nearly all G6 FX monitored are in 10+ days of bull flattening runs from peak to trough (US, CA exception w/bull steepeners). Australian government yields telegraph a rate cut near-term after the drop in yields in a steepener context.
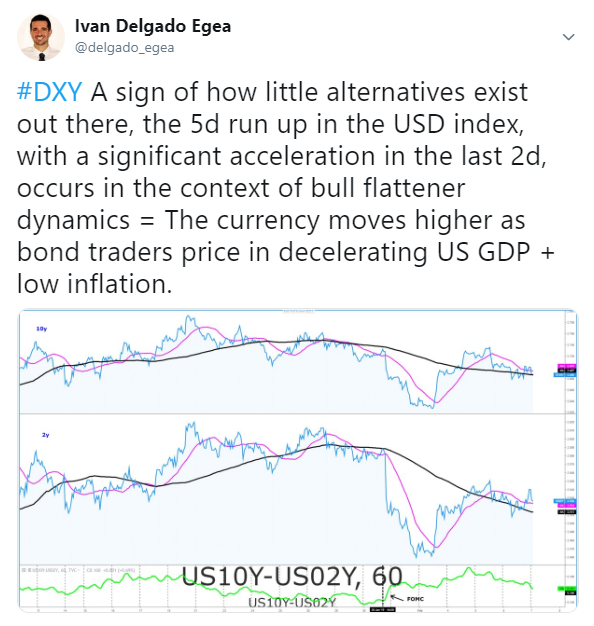
A sign of how little alternatives exist out there, the 5-day run-up in the USD index, with a significant acceleration in the last 2d, occurs in the context of bull flattener dynamics = The currency moves higher as bond traders price in decelerating U.S. GDP + low inflation.
Exc commodity currencies, FX options market not as bullish on the U.S. dollar heading into Thursday. USD/JPY impl vol rising a tad as 25-delta RR drops back sub -1 all while 110.00 macro resistance tested. If the DXY starts rolling over, UJ may have some catch down to do w/lower US30y.
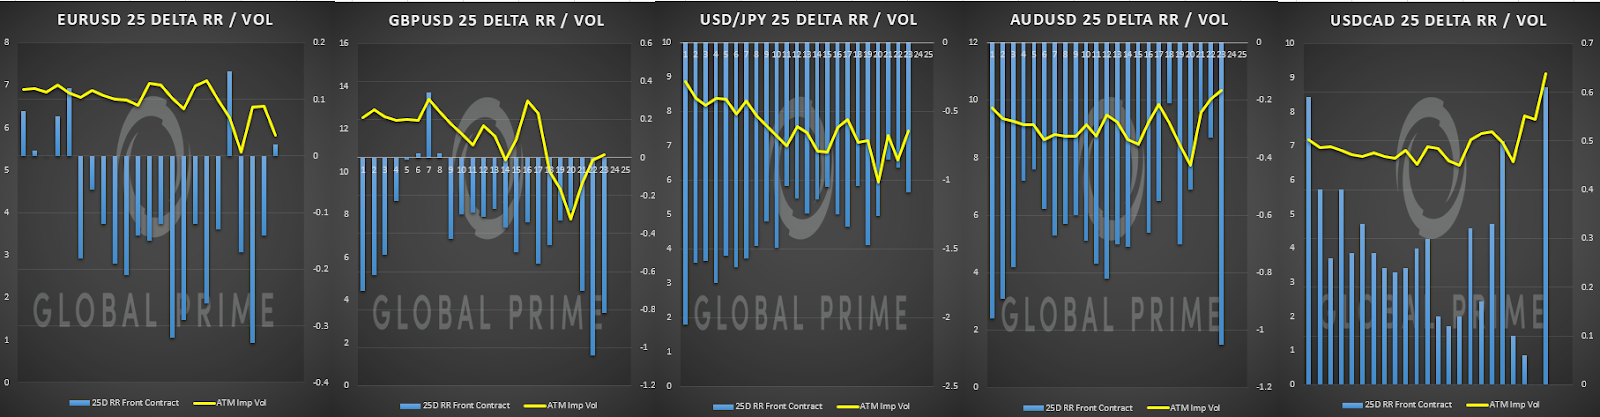
* The 25-delta risk reversal is the result of calculating the vol of the 25 delta call and discount the vol of the 25 delta put. … A positive risk reversal (call premiums rise vs puts) tends to be a bullish signal to expect higher spot prices according to option traders and vice versa if put premiums increase vs calls.
Source: http://cmegroup.quikstrike.net (The RR settles are ready ~1am U.K.).
Chart Insights: Technicals & Intermarket Analysis
EUR/USD: Non-Volatile Downward Channel, Sellers in Firm Control

The picture is undeniably bearish. For the technical-type traders, this is one of the best environment to trade as the trend is evolving in a fairly regular and non-volatile manner. The moves up are very much corrective in nature while the decline are much more impulsive. These dynamics speak loud and clear about the clear supply imbalances, which is resulting in a conducive order flow if one is looking to engage in a purely technical-led momentum trade dismissing other factors. Why do I mention dismissing other factors? Because this is not a trend backed up by the German vs U.S. bond yield spread, as the blue line clearly demonstrates (major divergence). It’s all about the rude strength of the DXY across the board as depicted by the magenta line. Regardless, when factoring intermarket analysis and volumes, one could make the case that any major technical area, as 1.1350–55 (horizontal support-bottom channel) could represent a solid proposition to stay relatively constructive in faking overextensions. However, one is going to need price action evidence for that, as the non-volatile/regular trends are the toughest to fight. If 1.1350 gives in, we could be looking into a potential acceleration towards 1.13. If the intermarket analysis stays as divergent vs price as it is today, that may create genuine buying opportunities.
GBP/USD: Topside Retest Rejected, Risk Of Follow-Through

The hourly chart exhibits enough technical credence to believe the downward pressure may continue in the near-term as the negative Brexit headlines keep piling in. The topside rejection of a short-term dynamic resistance in the form of a trendline off Feb 4th peak suggests any demand imbalance remains very weak in nature. The current conditions are characterized as an acceptance of price within a narrow range of 1.2975–1.2930, with a downward resolution to target a potential 100% extension of the range size towards the 1.2885 before price stabilizes. Both the U.K.-U.S. bond yield spread (blue) and the DXY (magenta) strength are in alignment to exert further selling pressure.
USD/JPY: Range Phase W/Topside Heavily Offered

It’s been 5 times that the rate has attempted to break past the 110.00, and every time, the same selling pressure is found. Can we resort to intermarket analysis to try to understand why such cluster of offers at 110.00 is so heavy? Yes, we can. Not only it represents a major maco resistance, which by itself makes it richer in liquidity, but we should not forget that the last 2 days worth of DXY gains occur in the content of a bull flattener phase, which essentially means lower U.S. yields (as the 30-yr U.S. bond yield in green reflects). That’s adding extra selling pressure circa 110.00. Besides, the M type formation (read potential double bottom) in the S&P 500 as the orange line shows, is another factor capping the upside potential for now. The market remains stubbornly bid due to the rampant movements seen in the DXY, as the magenta line shows. Technically, we’ve entered range-bound conditions between 110.00 and 109.50–55. Buying or selling off the edges offers the best risk-reward. The midpoint of the range at 109.80 (tested several times) can be used as a reference to gauge the side most in control of price action. Since the range was established on Feb 5th, bulls have managed to find equilibrium on the upper half far more often than sellers sub 109.80, which for now is a testament that the buy-side interest remains strong and unlikely to go away unless the DXY rolls over.
AUD/USD: Smoked As Aus Yields Fall Sharply

To understand the brutal mark-down in the Aussie in the last 24h, one must resort to the re-anchoring of the correlation between the currency pair and its yield spread as investors finally pay much closer attention to domestic factors in the Australian economy. This newly found correlation with the AU vs U.S. bond yield spread has been running on a factor above 0.75/0.80 for most of the week. As of Feb 7th in the Asian session, the spread keeps widening in favor of the U.S., which should act as an underpinning element to keep the sell-side pressure well and alive. To top it off, the Aussie has found even further sell-side pressure from the rude strength in the DXY, as the magenta line depicts (it also includes the Chinese Yuan factored in). The next level of key support for the Aussie can be found circa 0.7075–0.7080 ahead of 0.7050 (demand imbalance Jan 7th).
Important Footnotes
- Risk model: The fact that financial markets have become so intertwined and dynamic makes it essential to stay constantly in tune with market conditions and adapt to new environments. This prop model will assist you to gauge the context that you are trading so that you can significantly reduce the downside risks. To understand the principles applied in the assessment of this model, refer to the tutorial How to Unpack Risk Sentiment Profiles
- Cycles: Markets evolve in cycles followed by a period of distribution and/or accumulation. The weekly cycles are highlighted in red, blue refers to the daily, while the black lines represent the hourly cycles. To understand the principles applied in the assessment of cycles, refer to the tutorial How To Read Market Structures In Forex
- POC: It refers to the point of control. It represents the areas of most interest by trading volume and should act as walls of bids/offers that may result in price reversals. The volume profile analysis tracks trading activity over a specified time period at specified price levels. The study reveals the constant evolution of the market auction process. If you wish to find out more about the importance of the POC, refer to the tutorial How to Read Volume Profile Structures
- Tick Volume: Price updates activity provides great insights into the actual buy or sell-side commitment to be engaged into a specific directional movement. Studies validate that price updates (tick volume) are highly correlated to actual traded volume, with the correlation being very high, when looking at hourly data. If you wish to find out more about the importance tick volume, refer to the tutorial on Why Is Tick Volume Important To Monitor?
- Horizontal Support/Resistance: Unlike levels of dynamic support or resistance or more subjective measurements such as fibonacci retracements, pivot points, trendlines, or other forms of reactive areas, the horizontal lines of support and resistance are universal concepts used by the majority of market participants. It, therefore, makes the areas the most widely followed and relevant to monitor. The Ultimate Guide To Identify Areas Of High Interest In Any Market
- Trendlines: Besides the horizontal lines, trendlines are helpful as a visual representation of the trend. The trendlines are drawn respecting a series of rules that determine the validation of a new cycle being created. Therefore, these trendline drawn in the chart hinge to a certain interpretation of market structures.
- Correlations: Each forex pair has a series of highly correlated assets to assess valuations. This type of study is called inter-market analysis and it involves scoping out anomalies in the ever-evolving global interconnectivity between equities, bonds, currencies, and commodities. If you would like to understand more about this concept, refer to the tutorial How Divergence In Correlated Assets Can Help You Add An Edge.
- Fundamentals: It’s important to highlight that the daily market outlook provided in this report is subject to the impact of the fundamental news. Any unexpected news may cause the price to behave erratically in the short term.
- Projection Targets: The usefulness of the 100% projection resides in the symmetry and harmonic relationships of market cycles. By drawing a 100% projection, you can anticipate the area in the chart where some type of pause and potential reversals in price is likely to occur, due to 1. The side in control of the cycle takes profits 2. Counter-trend positions are added by contrarian players 3. These are price points where limit orders are set by market-makers. You can find out more by reading the tutorial on The Magical 100% Fibonacci Projection