The much anticipated FOMC meeting concluded yesterday with the Federal Reserve hiking interest rates by 25 basis points. At the meeting, the central bank's projection for rate hikes next year was in line with market expectations. The Fed projected three rate hikes for 2018 and two rate hikes for 2019. The rate hike yesterday saw two dissenting votes from Evans and Kashkari.
In the UK, the monthly labor market data showed that the UK's unemployment rate was unchanged at 4.1% but wage growth continued to remain weak in comparison to the the inflation.
Looking ahead, a busy day on the economic calendar is marked by central bank meetings from the Swiss National Bank, European Central Bank and the Bank of England. No monetary policy changes are expected from either of the central bank meetings making the forward guidance key in anticipation of future policy actions.
In the U.S. the monthly retail sales numbers will be released with forecasts pointing to a strong rebound in retail sales. The flash manufacturing and services PMI numbers are also expected today followed by BoC Gov. Poloz's speech.
EUR/USD intra-day analysis

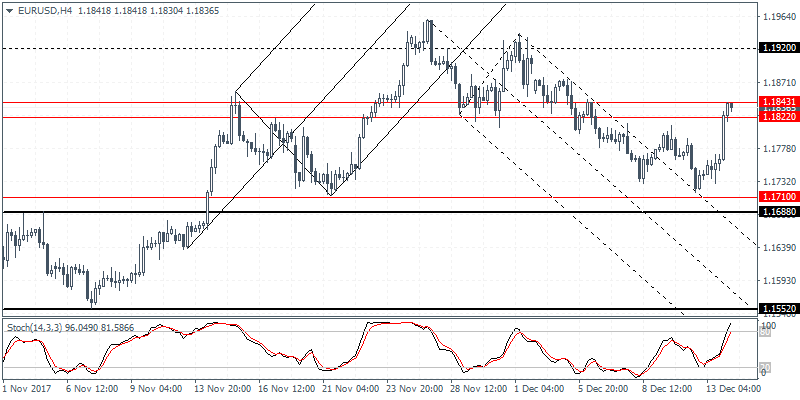
EUR/USD (1.1836): The EUR/USD rallied to close at a five day high yesterday following the FOMC meeting. The reversal near the 1.1730 level of support could potentially point to a head and shoulders pattern that is currently forming. If we expect to see a reversal resulting in the right shoulder, then we can expect further declines in EUR/USD on a break down below 1.1730 neckline support. On the 4-hour chart, price action has hit the resistance level area of 1.1843 - 1.1822. Further gains can be expected only on a close above this level.
USD/JPY intra-day analysis

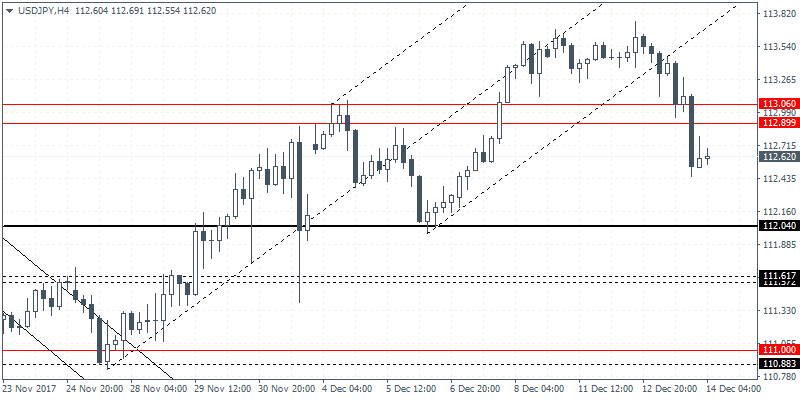
USD/JPY (112.62): The USD/JPY posted strong declines yesterday as the U.S. dollar fell to a four day low. On the 4-hour chart, price closed below the support level of 113.00 - 112.90. Any short term retracement will see price retesting this level to establish support. To the downside, USD/JPY could be seen pushing lower to test the next support formed at 112.04. Alternately, in the event that USD/JPY manages to break past the 113.00 level, we can expect to see the bullish momentum resuming. However, it is unlikely as USD/JPY could be seen maintaining a sideways range within 113.00 and 112.04.
NZD/USD intra-day analysis

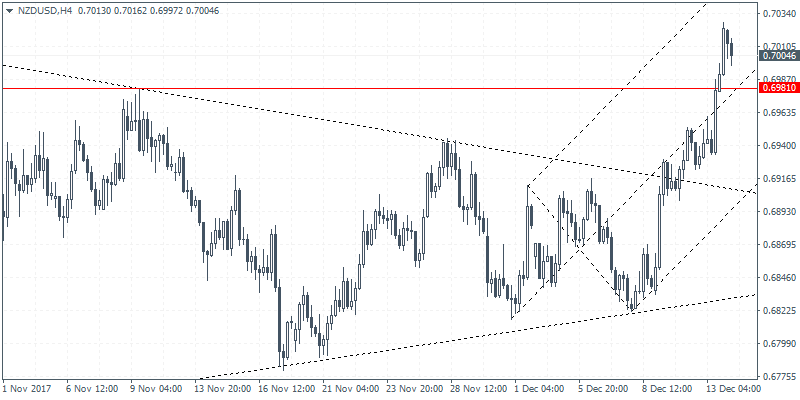
NZD/USD (0.7004): The New Zealand dollar managed to break past the 0.6891 level of resistance with price action maintaining the bullish momentum. Any retracements could be seen falling back to this level to establish support. To the upside, the next target for NZD/USD comes in at 0.7062 where the next main resistance level remains to be tested. In the event that NZD/USD slips back below the 0.6891 support level, we could expect to see the declines retesting the previous lower support at 0.6907.
