
Quick Take
The macro backdrop remains unaltered (USD negative) even if the outcome of the FOMC minutes has served well to the world’s reserve currency in finding positive short-term flows. There were two key messages by the Fed in its minutes, the one that reinforces the notion that the balance sheet runoff will most likely come to an abrupt halt sooner rather than later (risk positive). QE to infinity anyone? The other has to do with tentative signs that the Fed might not be done yet with tightening monetary policy, or at least that’s what they seem to suggest by noting that ‘if uncertainty abated, the Committee would need to reassess the characterization of monetary policy as patient and might then use a different language’. In layman’s terms, the Fed still retains a vague tightening bias. That’s precisely what gave the USD a much needed short-term impulse. Although as I elaborate in the charts below, the yuan strength story is a bigger one to drive markets these days, hence why the recently established weak macro trend in the DXY still faces the prospects of finding further legs down. Remember, whatever I compile as info, should be taken with the framework in mind of being open to daily changes in rhetoric flows, that’s why I always emphasize that the most I can do is to provide the general bias made available via charts by the time markets close for business in NY.
Narratives in Financial Markets
FOMC minutes vindicates the widely assumed prognosis of a much more ‘patient’ Fed this year even if there is sufficient evidence in the statement to not rule out the prudent bias as conclusive. Nonetheless, short-term, the Fed’s focus has shifted to slowing global growth concerns and the debilitated economic situation out of China. It was a risky friendly input to read that almost all officials wanted to halt the Fed’s balance-sheet runoff later this year.
The U.K. has been placed on credit rating watch for a potential negative revision by Fitch. No surprise as the scenario of a no-deal Brexit would be catastrophic for the economy. To make matters worse, 3 conservative MPs have announced their resignation, which is a testament of the major differences and cracks currently in existence in U.K. PM’s May government. On Brexit, U.K. PM May is fully focused on legally-binding changes to the Irish border.
U.S. President Trump has tweeted that negotiations with the EU on trade are currently underway, threatening to impose tariffs if there is no deal. There is no set deadline but no resolution is expected for at least another month or two, so not a market focus for now.
As part of the U.S.-China trade talks, a key headline crossing the screen on Wednesday was the statement by China’s foreign ministry that they won’t use the exchange rate as a tool in the trade dispute. This seems to reflect an aversion to agree on any memorandum of understanding with the U.S. that may involve a stable currency pledge. Not a positive headline as the currency exchange seems to be at the core as a contentious sticking point to address before a trade deal.
Australian wage inflation is nowhere to be found, as it’s been the case for years now. The Q4 wage price index came at +0.5% vs +0.6% expected.
Potential Economic Indicators
With the Australian jobs report out of the way, the focus now turns towards EU PMIs, the ECB monetary policy minutes and a raft of U.S. data.
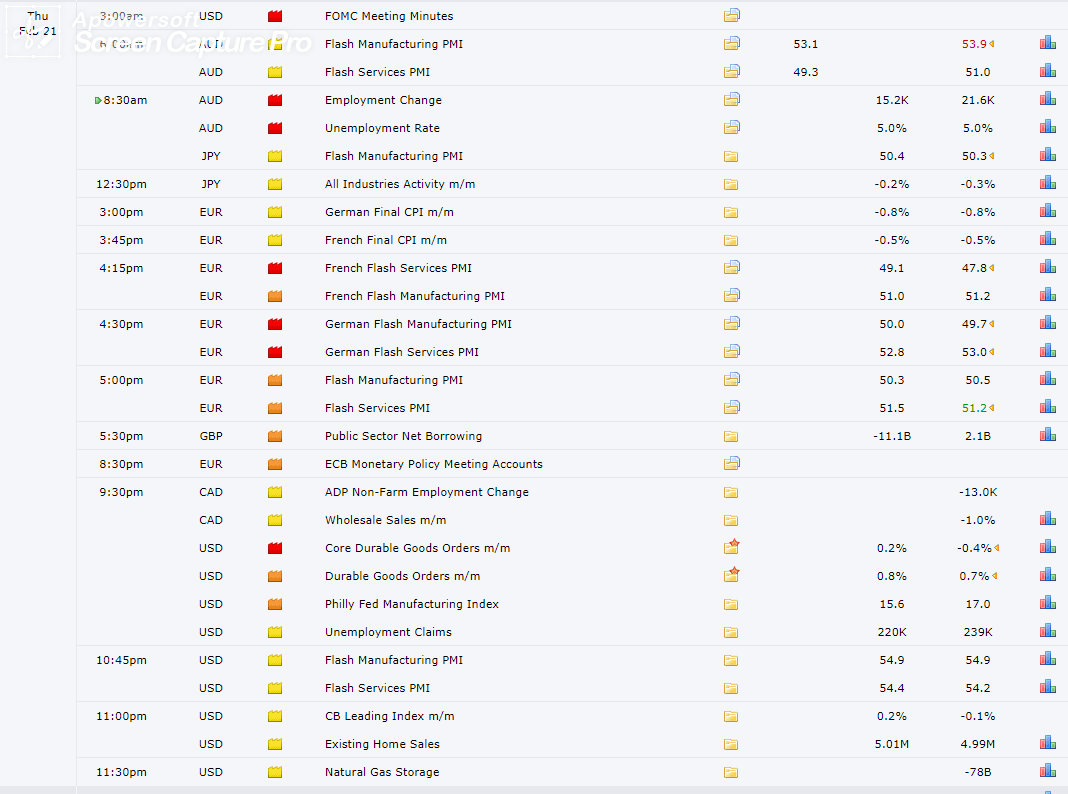
Source: Forexfactory
RORO - Risk On Risk Off Conditions
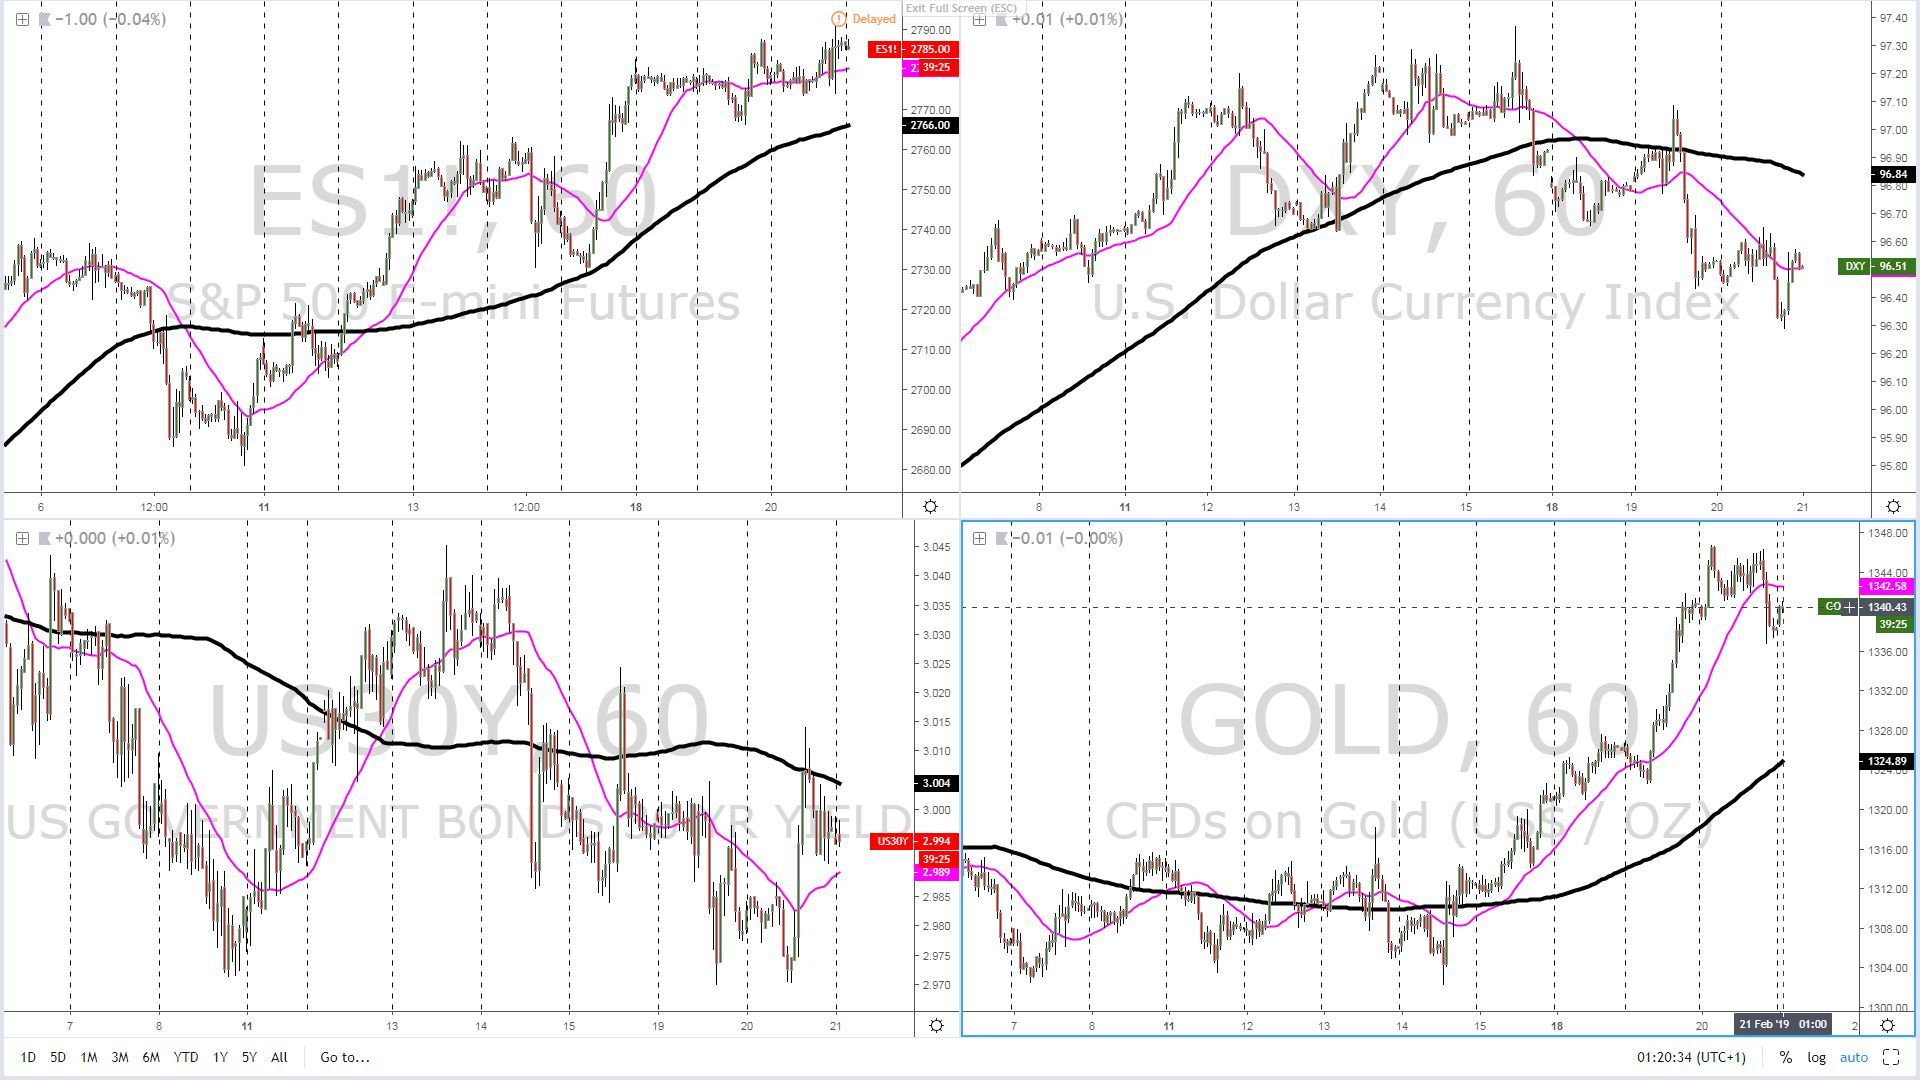
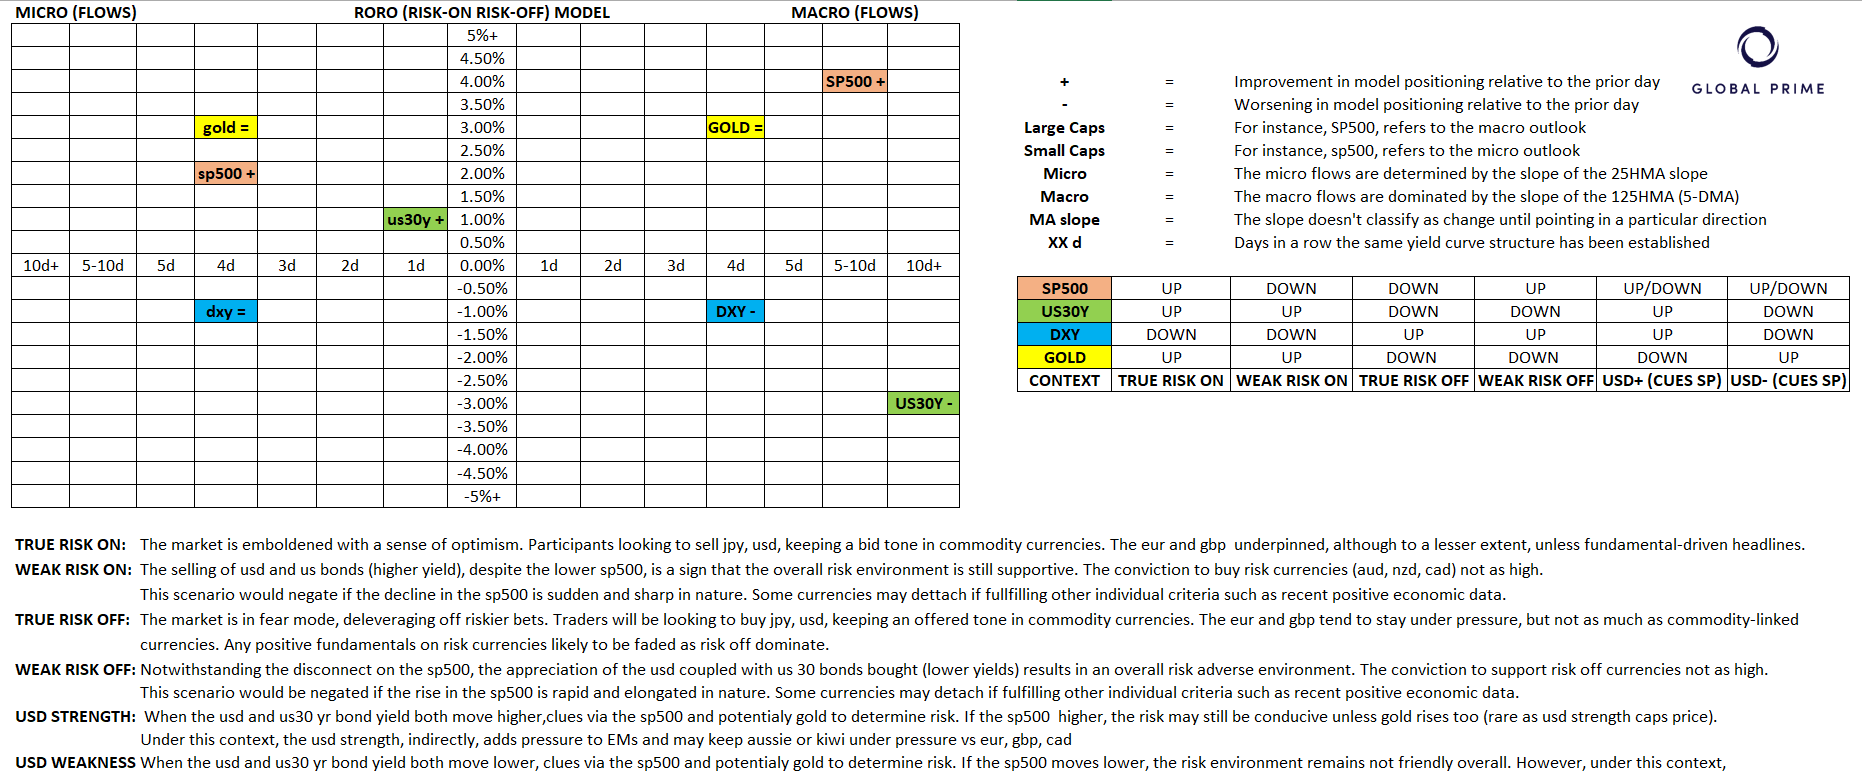
From a microflows perspective, using the slope of the 25-HMA as a handy reference to visually represent the latest dynamics, we’ve transitioned into a ‘true risk on’ environment as the long-dated U.S. 30-yr bond yields make a bullish successful rotation post the FOMC minutes. The Fed sees to have implied that the tightening campaign is not dead and buried yet, and that’s played nicely as a bearish narrative to sell U.S. bonds (higher yields), even if that still represent a drop in the ocean compared to the radical dovish shift since Powell’s Put. The more constructive outlook (only short-term) in the U.S. yields, coupled with stable equity demand, and a U.S. dollar still not finding it mojo judging by the recently downward slope in the 25-HMA, results in a microenvironment still implying that beta currencies should do well vs the likes of safe havens (JPY, USD). From a 5-day view, a time horizon that I use as a reference to gauge the more macro flows in light of the current flow-driven state of affairs in currency markets, the characterization of dynamics falls under USD weakness in the context of rising equities, which is also a landscape supporting risk for now.
Dashboard: Intermarket Flows And Technical Analysis
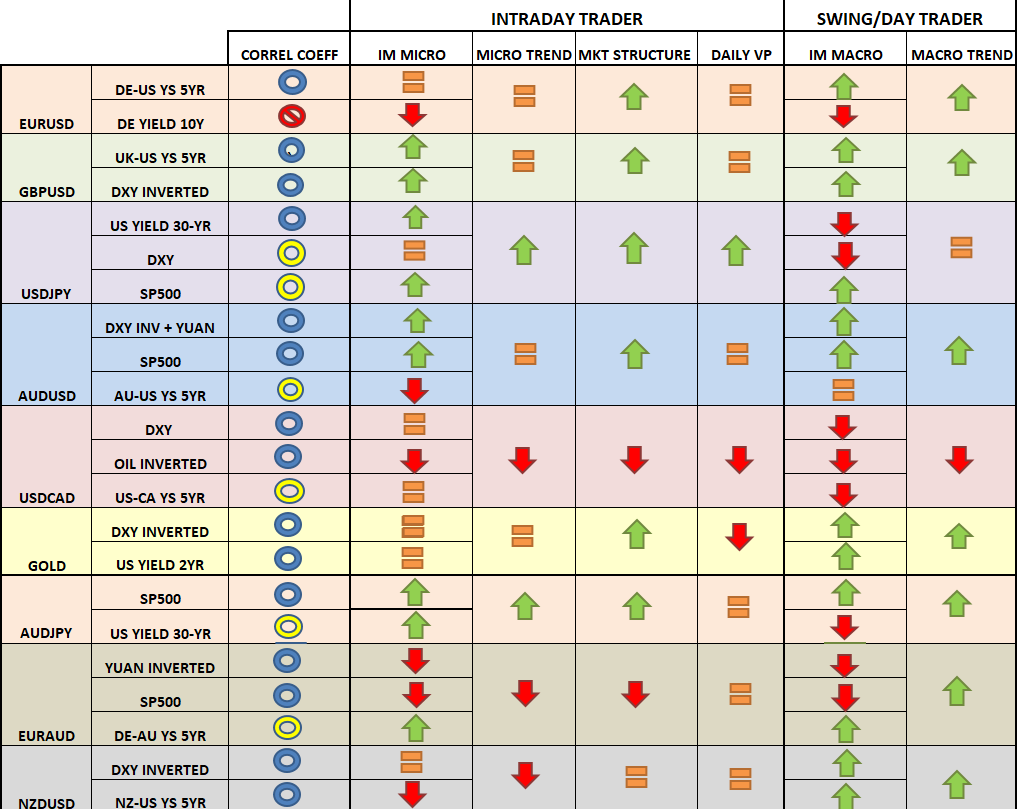
We find the euro established in a balance area between 1.13 and 1.1370 in the last 24h with the spike in demand towards the single currency rejected off the highs on the aftermath of the FOMC minutes. We can see through the volume profile formation the absence of any volume build up between the 1.1350-70 interval, clear communication of the supply imbalance it existed. As long as the ascending trendline holds, this is a market that should still be perceived as fairly constructive for the likes of both the intraday and the swing/day trader as both the micro and macro trends align, alongside the increasingly strong correlation with the positive German-U.S. bond yield spread.

A similar picture to contend with in the sterling, where the strong bullish momentum appears to be receding amid the overstretched nature of the run originated off the last balance area (grey box). It will be interesting to see if buyers can defend the ascending trendline off February 15th low. Until the thesis is proven wrong, this is a market that remains with the backing of technicals as well as intermark-flows, both at a micro and at a more macro level (5-day as reference or 125-HMA).

Contradicting forces keep the USD/JPY in a moribund stage, with the whippy moves from earlier this year a long memory away as we now need to contend with paltry 50 pip days. Technically, enough arguments can still be made to stay bullish, especially predicated on the most recent market structure. However, there are quite a few warning signs of a topping formation carving out. The slope of the 125-HMA (5-DMA) is starting to roll over for the first time in February, which occurs at a time when both the DXY and U.S. 30-yr bond yields have taken a downbeat in its macro slope too (5-DMA). What’s then keeping the market relatively sustained? The answer can be found on the rampant nature of the U.S. equity market, with the recent upward acceleration in the last week capping the downside. Keep an eye on the ascending trendline. If acceptance in the price is found below, this may represent significant technical damage. In the very short-term though, the intermarket flows have turned rather benign to think that range bound conditions may expand further until the U.S. data comes due.

When moving away from the Aussie jobs-led intraday volume noise, we can see that the market still portrays enough technical and intermarket merits to stay relatively constructive. We can observe that the key influencers in the price of the Aussie as of late include equities and the inverted DXY + inverted yuan performance. When taking these assets as the reference to gauge the next Aussie flows, one will be hard-pressed not to perceive intraday value as the slope of the correlated assets stand by the close of business in the last NY session. An ascending trendline is also keeping overall technical positive. At the most granular level, the last 24h, as depicted by the volume profile formation, we’ve entered a period of balance inflows between 0.7145-50 and 0.7180 (Australia jobs spike rejected off 72c).

Out of all the majors, the Canadian dollar still looks like the best positioned to capitalize on the macro USD weakness. All the factors a seller would want to see in their favor such as micro and macro trend, technicals (lower lows and lower highs), intermarket support (Oil inverted + DXY) are present. With this backdrop in mind, the overall bias still remains one of selling strength as the main course of action with the intent to generate the most rewards vs risks taken. Remember, this is a market that remains extremely fixated towards the DXY and Oil as the key determiners of the next flows.

What about Gold? In the short-run, the elongated move is starting to falter as momentum traders bail from an active involvement on the back of the FOMC minutes, which caused a positive reaction in both the DXY and the 2-yr U.S. yields (proxy Fed Funds). The macro outlook remains as bullish as it’s been for a long time, but at the most granular level, the market has further room to adjust lower if the sync movements in the DXY inverted and the U.S. 2yr bond yields keep the southbound course.

With regards to the yen crosses, the short-term outlook continues to be constructive as observed by the reversion back to an upward 25-HMA slope in both the S&P 500 and U.S./global bond yields. Conditioned to both correlated assets staying supported, dips in yen crosses (AUD/JPY, EUR/JPY, CAD/JPY, etc) should be seen as interesting propositions to consider longs. In terms of technicals, both the market structure and the micro trends are also buoyant components.

Similar to the AUD/USD, but removing the DXY as an influencer, the EUR/AUD still looks set to be a ‘sell on strength’ type of market judging by the signals from both equities, which is keeping implied volatility fairly low (VIX), and the yuan strength, as the red line (yuan) demonstrates. The spike higher in today’s Asian session should meet grateful sellers towards the 125-HMA (downward sloping).

Last, the Kiwi is a market that has gradually transitioned from an extreme bullish momentum after the surprisingly neutral RBNZ monetary policy outcome from last week, to then start consolidating within a 0.6820-0.69 range, only to form an even more granular balance area on Wednesday, which seems to be giving in as I type, placing the focus back down towards the 0.6820 bottom of the range. In the grand scheme of things, the market is supported in the macro picture by upward slopes in the 5-DMA derived from the currency pair pricing, the DXY inverted and the NZ-U.S. bond yield spread, suggesting that is going to take considerable supply power at the micro flow level to break through 0.68-6820.

Important Footnotes
- Risk model: The fact that financial markets have become so intertwined and dynamic makes it essential to stay constantly in tune with market conditions and adapt to new environments. This prop model will assist you to gauge the context that you are trading so that you can significantly reduce the downside risks. To understand the principles applied in the assessment of this model, refer to the tutorial How to Unpack Risk Sentiment Profiles
- Cycles: Markets evolve in cycles followed by a period of distribution and/or accumulation. The weekly cycles are highlighted in red, blue refers to the daily, while the black lines represent the hourly cycles. To understand the principles applied in the assessment of cycles, refer to the tutorial How To Read Market Structures In Forex
- POC: It refers to the point of control. It represents the areas of most interest by trading volume and should act as walls of bids/offers that may result in price reversals. The volume profile analysis tracks trading activity over a specified time period at specified price levels. The study reveals the constant evolution of the market auction process. If you wish to find out more about the importance of the POC, refer to the tutorial How to Read Volume Profile Structures
- Tick Volume: Price updates activity provides great insights into the actual buy or sell-side commitment to be engaged into a specific directional movement. Studies validate that price updates (tick volume) are highly correlated to actual traded volume, with the correlation being very high, when looking at hourly data. If you wish to find out more about the importance tick volume, refer to the tutorial on Why Is Tick Volume Important To Monitor?
- Horizontal Support/Resistance: Unlike levels of dynamic support or resistance or more subjective measurements such as fibonacci retracements, pivot points, trendlines, or other forms of reactive areas, the horizontal lines of support and resistance are universal concepts used by the majority of market participants. It, therefore, makes the areas the most widely followed and relevant to monitor. The Ultimate Guide To Identify Areas Of High Interest In Any Market
- Trendlines: Besides the horizontal lines, trendlines are helpful as a visual representation of the trend. The trendlines are drawn respecting a series of rules that determine the validation of a new cycle being created. Therefore, these trendline drawn in the chart hinge to a certain interpretation of market structures.
- Correlations: Each forex pair has a series of highly correlated assets to assess valuations. This type of study is called inter-market analysis and it involves scoping out anomalies in the ever-evolving global interconnectivity between equities, bonds, currencies, and commodities. If you would like to understand more about this concept, refer to the tutorial How Divergence In Correlated Assets Can Help You Add An Edge.
- Fundamentals: It’s important to highlight that the daily market outlook provided in this report is subject to the impact of the fundamental news. Any unexpected news may cause the price to behave erratically in the short term.
- Projection Targets: The usefulness of the 100% projection resides in the symmetry and harmonic relationships of market cycles. By drawing a 100% projection, you can anticipate the area in the chart where some type of pause and potential reversals in price is likely to occur, due to 1. The side in control of the cycle takes profits 2. Counter-trend positions are added by contrarian players 3. These are price points where limit orders are set by market-makers. You can find out more by reading the tutorial on The Magical 100% Fibonacci Projection