The U.S. dollar index was seen giving back the gains on Friday, following the speech by the Fed chair Jerome Powell at the annual Jackson Hole Symposium. The dollar index fully gave up the gains logged from Thursday. In his speech, Powell said that further tightening of interest rates was appropriate. The Fed chair also noted that there was no clear indication of inflation accelerating above the Fed's 2% inflation target rate.
Economic data was sparse on Friday. The final GDP report from Germany confirmed that the economy advanced 0.5% in the second quarter. Data from the U.S. showed that core durable goods orders rose just 0.2%. This missed estimates of a 0.5% increase. Headline durable goods orders declined 1.7% which was more than the 0.7% decline that was forecast.
Looking ahead, economic data is light for the day. The German Ifo business confidence report will be coming out. Economists forecast that the German business confidence index rose to 101.9 from 101.7 previously.
EUR/USD intraday analysis

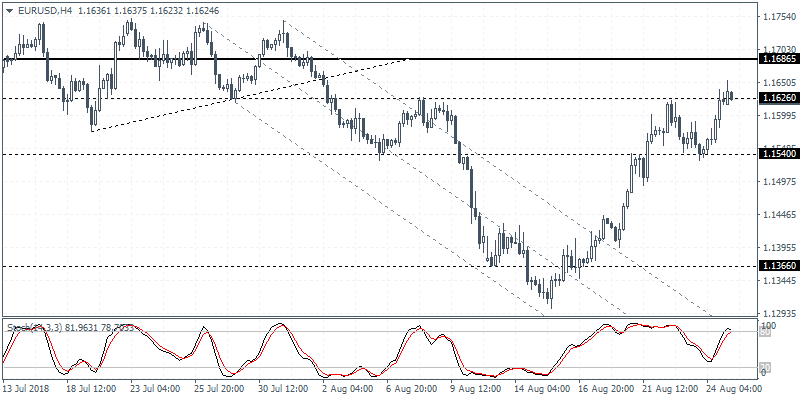
EUR/USD (1.1624):The EUR/USD currency pair was seen turning bullish on Friday following the rebound off the support at 1.1540 level. But the daily chart signals a bearish divergence against the previous highs formed at 1.1730. On the 4-hour chart, the EUR/USD currency pair was seen closing with a doji pattern alongside a bearish divergence. Therefore, we expect to see some downside price action to prevail. In the near term, the EUR/USD currency pair could remain range bound within 1.1626 and 1.1540 levels of resistance and support.
GBP/USD intraday analysis

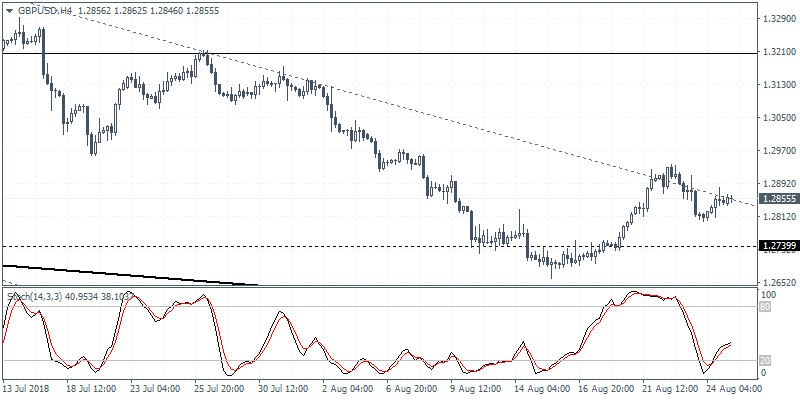
GBP/USD (1.2855):The GBP/USD currency pair closed bullish last week. The gains came following a doji reversal pattern formed the week before near 1.2740 area. This indicates a potential move to the upside for the GBP/USD. On the 4-hour chart, price action is seen trading alongside the upper trend line of the falling price channel. With the Stochastics showing weak momentum, we expect to see some downside prevail. Watch for GBP/USD to form a potential higher low ahead of further gains. The currency pair could be seen targeting the resistance level at 1.3205.
XAU/USD intraday analysis

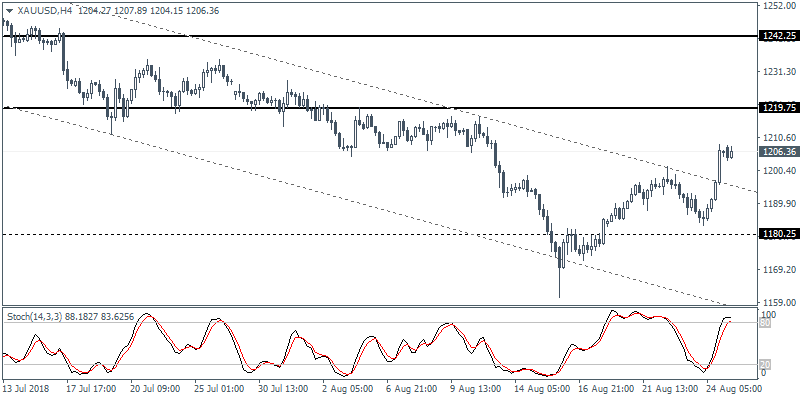
XAU/USD (1206.36):Gold prices closed with a strong bullish engulfing pattern on Friday. Price action was seen closing at 1206.00 as a result. However, the daily chart signals a divergence to the Stochastics which could indicate a near-term consolidation. On the 4-hour chart, gold prices breached the outer trend line of the falling price channel. This indicates a potential retracement ahead of further gains. Watch for a higher low to form as gold prices could be seen targeting the next main resistance level at 1219.75.
