Get 40% Off
⚠ Earnings Alert! Which stocks are poised to surge?
See the stocks on our ProPicks radar. These strategies gained 19.7% year-to-date.
Unlock full list

WTI And USD/JPY Analysis: February 13, 2018

Published 02/13/2018, 09:47 AM
Updated 03/21/2024, 07:45 AM

The International Energy Agency (IEA) today published their forecast for oil demand growth in 2018 at 1.4 million bpd from a previous projection of 1.3 million bpd. However, the boost in output, particularly in the U.S., will outweigh any growth in demand and increase global oil inventories. The IEA reported, “Today, having cut costs dramatically, U.S. producers are enjoying a second wave of growth so extraordinary that in 2018 their increase in liquids production could equal global demand growth”.

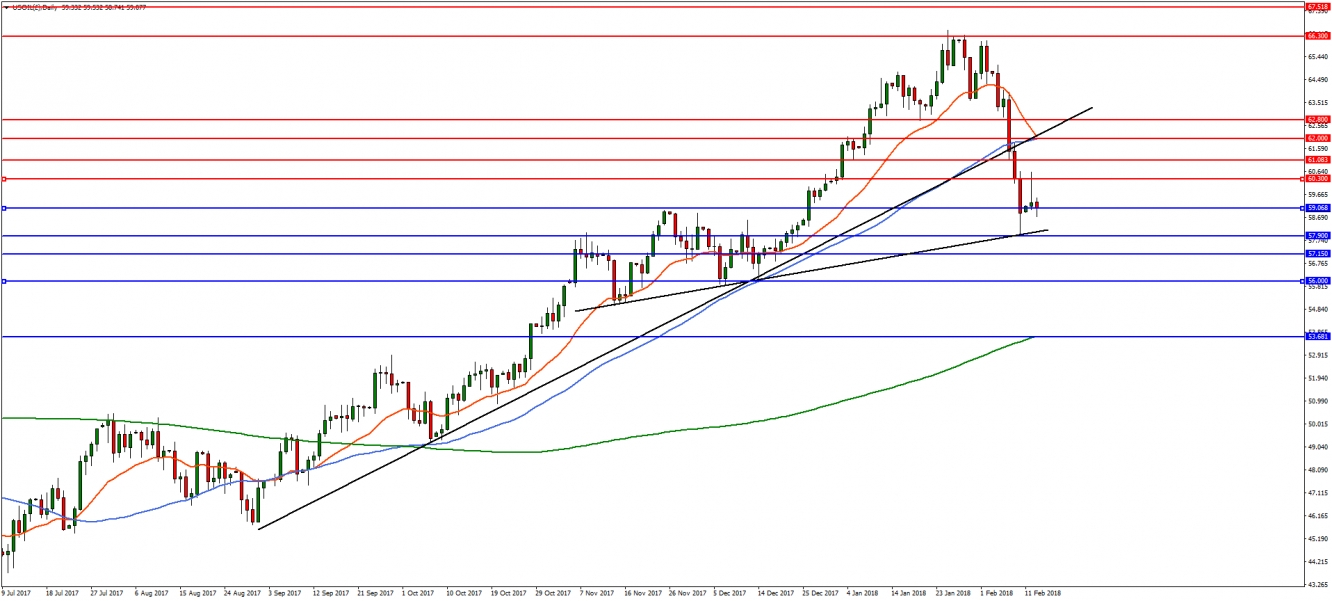
In the daily timeframe, WTI reversed from the 66.0 handle and declined to the October resistance trend line and horizontal support at 57.90. WTI now appears to be consolidating around the 59.0 support level. Continued downward pressure and a break of 59.00 would again find support at 57.90. After this, WTI could see deeper declines to the 38.2% Fibonacci retracement of the entire move from June 2017 at 57.15, followed by 56.0. Upward swings in WTI will likely be capped, with resistance at 60.30 and then 61.0.

WTI Daily Chart

USD/JPY

USD/JPY is trading below the 108.0 handle today, amid continued risk-aversion and the likelihood of Bank of Japan (BOJ) governor Kuroda being reappointed for a second term. There are also reports of a possible “stealth or back door tapering” by the BOJ, in a bid to allow longer-term interest rates in Japan to rise without reducing QE size.

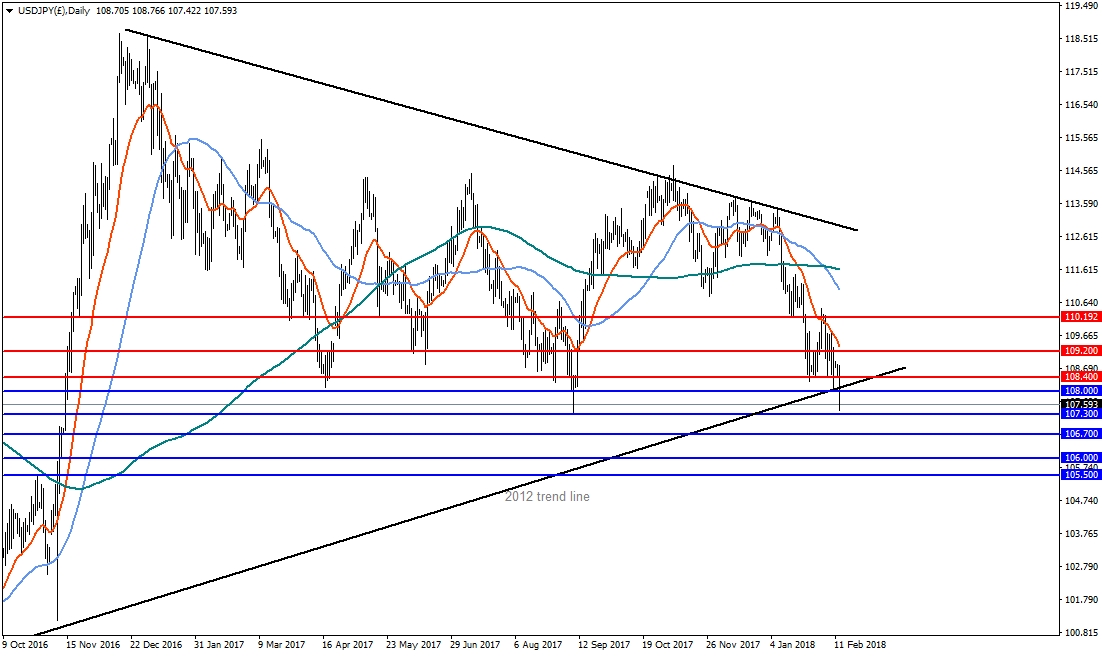
In the daily timeframe, USD/JPY has broken a long-term resistance trend line from 2012 to trade below 1.08. A close below 1.08 would result in further declines to near-term supports at 107.30 and 106.70. After this, the 105.50 level may become visible. A reversal would find initial resistance at 108.40 and then 109.20.

USDJPY Daily Chart

Latest comments

Risk Disclosure: Trading in financial instruments and/or cryptocurrencies involves high risks including the risk of losing some, or all, of your investment amount, and may not be suitable for all investors. Prices of cryptocurrencies are extremely volatile and may be affected by external factors such as financial, regulatory or political events. Trading on margin increases the financial risks.
Before deciding to trade in financial instrument or cryptocurrencies you should be fully informed of the risks and costs associated with trading the financial markets, carefully consider your investment objectives, level of experience, and risk appetite, and seek professional advice where needed.
Fusion Media would like to remind you that the data contained in this website is not necessarily real-time nor accurate. The data and prices on the website are not necessarily provided by any market or exchange, but may be provided by market makers, and so prices may not be accurate and may differ from the actual price at any given market, meaning prices are indicative and not appropriate for trading purposes. Fusion Media and any provider of the data contained in this website will not accept liability for any loss or damage as a result of your trading, or your reliance on the information contained within this website.
It is prohibited to use, store, reproduce, display, modify, transmit or distribute the data contained in this website without the explicit prior written permission of Fusion Media and/or the data provider. All intellectual property rights are reserved by the providers and/or the exchange providing the data contained in this website.
Fusion Media may be compensated by the advertisers that appear on the website, based on your interaction with the advertisements or advertisers.
© 2007-2024 - Fusion Media Limited. All Rights Reserved.