Get 40% Off
⚠ Earnings Alert! Which stocks are poised to surge?
See the stocks on our ProPicks radar. These strategies gained 19.7% year-to-date.
Unlock full list

U.S. Tech Sector Blow-Off Top In Progress

Published 02/25/2020, 01:30 AM
Updated 07/09/2023, 06:31 AM

Further to my post of February 10 regarding the BMO REX MicroSectors FANG Index 3X Leveraged ETF (NYSE:FNGU) (an exchange-traded note that tracks 3x the daily price movements on an index of U.S.-listed technology and consumer discretionary companies) and the NASDAQ Composite Index, the following scenario developed:

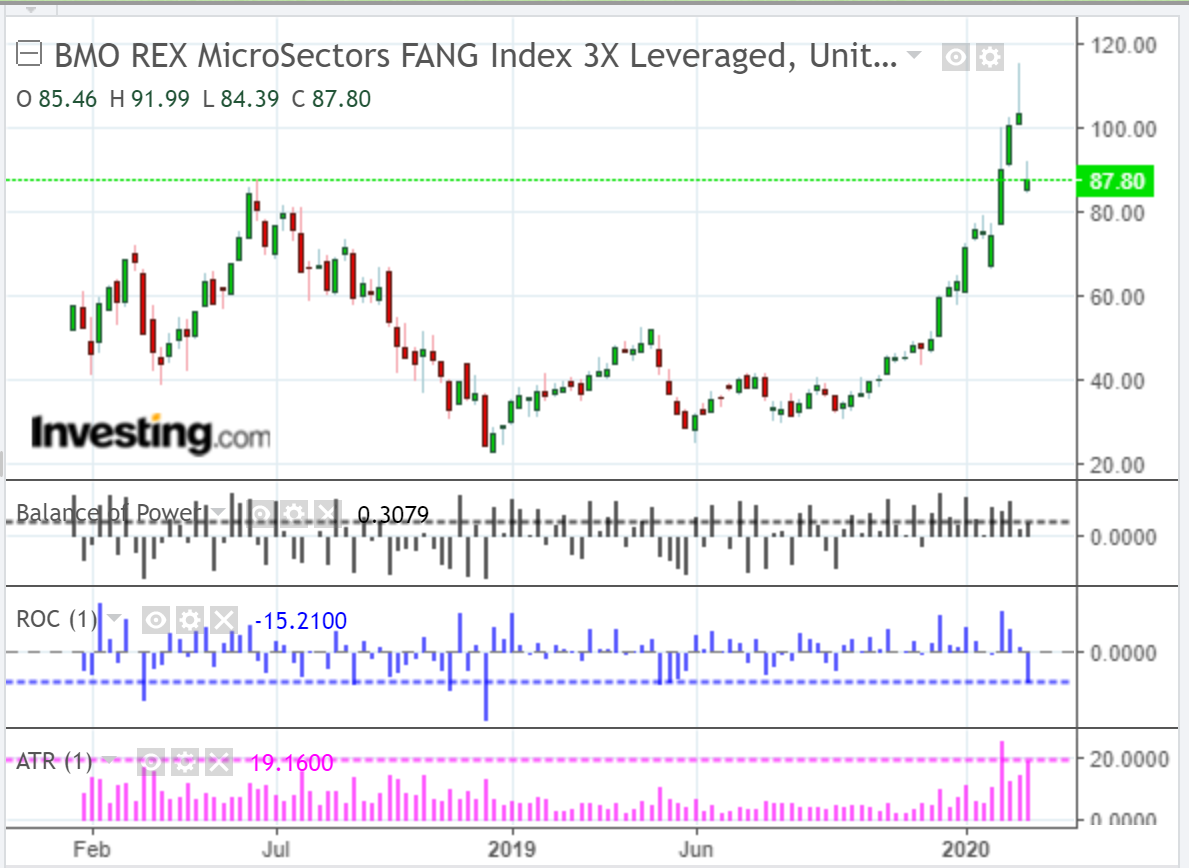
  • FNGU did retest its prior all-time high, blew past it, and made a new high at 115.40 last week, as shown on the weekly chart below.
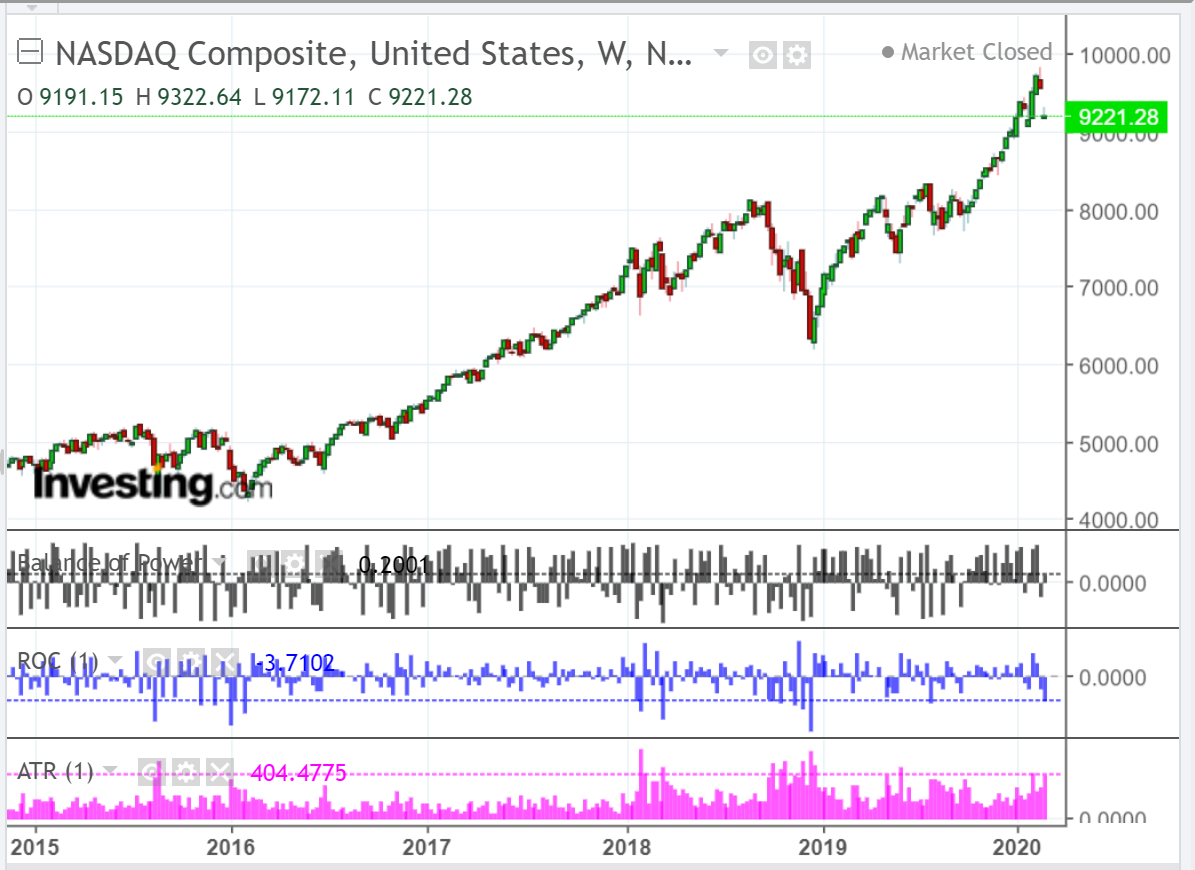
  • The Nasdaq Composite Index did attempt to reach 10,000, but stopped short at its new all-time high of 9838.37 last week, as shown on the weekly chart below.
  • After they both formed a shooting star candle last week, they gapped down considerably yesterday (Monday) to close near their low of the day.
  • You can see, from the last two chartgrids (daily timeframe), that all of the ten tech stocks which comprise FNGU gapped and closed down on Monday, as well.
  • So, where do they all go from here?

  • The Balance of Power on FNGU and the Nasdaq Composite Index still lies with the buyers on the weekly timeframe, but that is fading quickly. Watch for a drop and hold below zero to indicate that a larger blow-off is developing. Otherwise, if it holds above zero, look for some short-term buying or short-covering or a dead cat bounce before further selling, potentially, resumes.
  • Keep an eye on the ROC (Rate of Change) and ATR (Average True Range) to confirm, either further selling, or a sharp turnaround in buying. I've shown the input value on both of these technical indicators as one period and in histogram format to highlight extreme movements in either direction. Neither one has matched prior all-time extremes yet, so we may see further selling before any serious longer-term buyers step into the Technology sector.
  • You can see from the last two chartgrids where Monday's closing price on each of the ten stocks, as well as FNGU and the Nasdaq Composite Index, sits in relation to their respective 50-day moving average (red). They are either above, below or near it, which is acting as support or resistance. Three of them (Facebook (NASDAQ:FB), Alibaba (NYSE:BABA) and Baidu (NASDAQ:BIDU)) are the weakest, after failing to make new swing highs, and their 20-day MA is in the process of crossing below their 50-day MA...hinting at further weakness ahead for these three stocks. The ROC on 8 out of the 12 are below the zero level...hinting at further weakness ahead for the Tech sector. Keep an eye on the ROC on NVIDIA (NASDAQ:NVDA), Tesla (NASDAQ:TSLA), Twitter (NYSE:TWTR) and FNGU on the daily timeframe...if they also drop and hold below zero, and if the others hold below, watch for further sharp selling in the Tech sector.
  • Finally, keep an eye on the 4 E-mini Futures Indices and the SPX:VIX ratio mentioned in my last post. If we see further weakness develop in those, we'll likely see continued selling in the above-referenced stocks, ETF and Index.
  • FNGU Weekly Chart
    NASDAQ Weekly Chart
    Tech Sector Shares Daily
    Tech Sector Shares Weekly

    Latest comments

    Excellent input. Thx
    Thanks Candy
    Risk Disclosure: Trading in financial instruments and/or cryptocurrencies involves high risks including the risk of losing some, or all, of your investment amount, and may not be suitable for all investors. Prices of cryptocurrencies are extremely volatile and may be affected by external factors such as financial, regulatory or political events. Trading on margin increases the financial risks.
    Before deciding to trade in financial instrument or cryptocurrencies you should be fully informed of the risks and costs associated with trading the financial markets, carefully consider your investment objectives, level of experience, and risk appetite, and seek professional advice where needed.
    Fusion Media would like to remind you that the data contained in this website is not necessarily real-time nor accurate. The data and prices on the website are not necessarily provided by any market or exchange, but may be provided by market makers, and so prices may not be accurate and may differ from the actual price at any given market, meaning prices are indicative and not appropriate for trading purposes. Fusion Media and any provider of the data contained in this website will not accept liability for any loss or damage as a result of your trading, or your reliance on the information contained within this website.
    It is prohibited to use, store, reproduce, display, modify, transmit or distribute the data contained in this website without the explicit prior written permission of Fusion Media and/or the data provider. All intellectual property rights are reserved by the providers and/or the exchange providing the data contained in this website.
    Fusion Media may be compensated by the advertisers that appear on the website, based on your interaction with the advertisements or advertisers.
    © 2007-2024 - Fusion Media Limited. All Rights Reserved.