Get 40% Off
⚠ Earnings Alert! Which stocks are poised to surge?
See the stocks on our ProPicks radar. These strategies gained 19.7% year-to-date.
Unlock full list

U.S. Stocks Top Weekly Performance List As REITs Sink

Published 01/15/2018, 07:00 AM
Updated 07/09/2023, 06:31 AM

US equities led most markets higher last week, posting the strongest gain among the major asset classes, based on a set of exchange-traded products. Meanwhile, real estate investment trusts (REITs) in the US suffered the biggest weekly loss, extending a slide for this yield-sensitive sector in the wake of rising Treasury yields.

Vanguard Total Stock Market (NYSE:VTI) was up 1.7% for the five trading days through Jan. 12, closing at yet another record high. The ETF’s upside bias marks an extraordinary run higher in recent months. Indeed, VTI’s latest advance is the 16th weekly increase in the past 18 weeks.

Last week’s biggest loser: Vanguard REIT (NYSE:VNQ), which slumped a hefty 3.0%. The slide is the fund’s second weekly decline and its deepest since last March. The selling left VNQ’s closing price on Friday at nearly 5% below its 200-day moving average – the biggest downside gap since November.
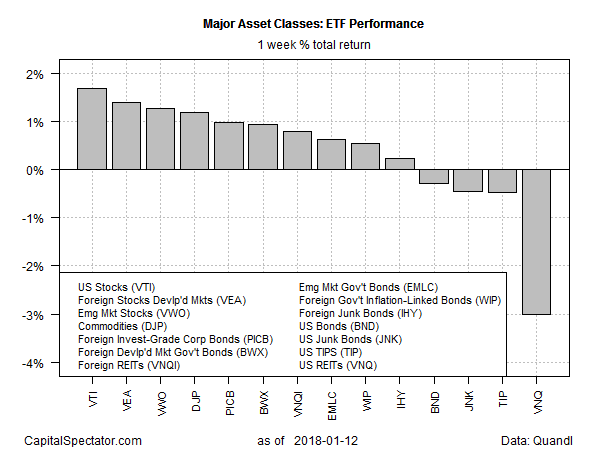
Major Asset Classes ETF Performance

For the one-year trend, emerging-markets stocks remain firmly in the lead for the major asset classes. Vanguard FTSE Emerging Markets (NYSE:VWO) is up 33.2% for the year through last week’s close.

The only loss for the one-year change at the moment is in US REITs. VNQ’s posted a small 0.9% decline at last week’s close vs. the year-earlier price.
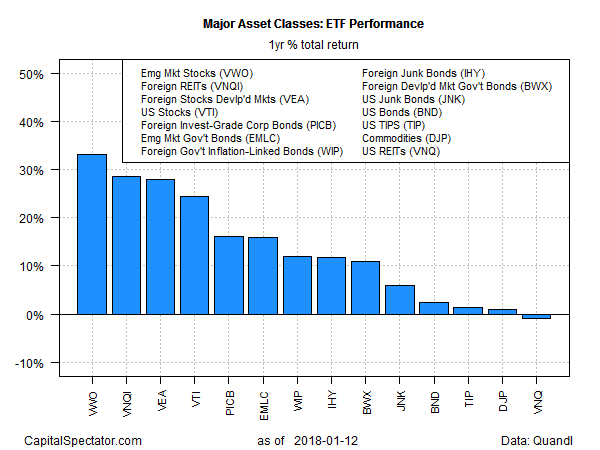
Major Asset Classes ETF Performance

Overall, positive momentum remains strong for most corners of the major asset classes. Consider how current drawdowns stack up. The majority of markets are posting zero or relatively low peak-to-trough declines as of last week’s close.

The main exception: broadly defined commodities. Although iPath Bloomberg Commodity Total Return Exp 12 June 2036 (NYSE:DJP) has rallied in recent months, this exchange-traded note remains a conspicuous outlier for drawdowns vs. the rest of the field. At the end of last week’s trading DJP was down 45% from its previous peak.
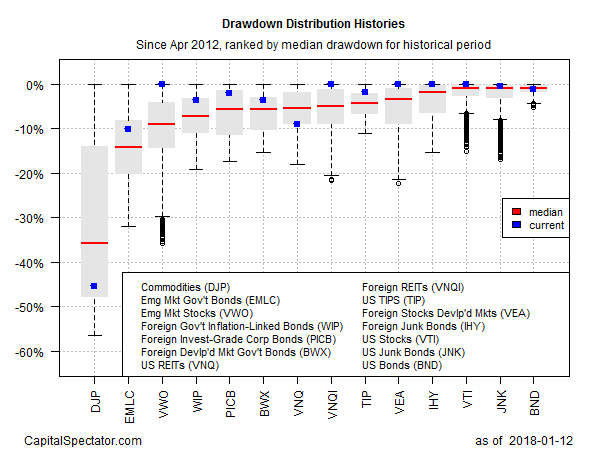
Drawdown Distribution Histories

Latest comments

Risk Disclosure: Trading in financial instruments and/or cryptocurrencies involves high risks including the risk of losing some, or all, of your investment amount, and may not be suitable for all investors. Prices of cryptocurrencies are extremely volatile and may be affected by external factors such as financial, regulatory or political events. Trading on margin increases the financial risks.
Before deciding to trade in financial instrument or cryptocurrencies you should be fully informed of the risks and costs associated with trading the financial markets, carefully consider your investment objectives, level of experience, and risk appetite, and seek professional advice where needed.
Fusion Media would like to remind you that the data contained in this website is not necessarily real-time nor accurate. The data and prices on the website are not necessarily provided by any market or exchange, but may be provided by market makers, and so prices may not be accurate and may differ from the actual price at any given market, meaning prices are indicative and not appropriate for trading purposes. Fusion Media and any provider of the data contained in this website will not accept liability for any loss or damage as a result of your trading, or your reliance on the information contained within this website.
It is prohibited to use, store, reproduce, display, modify, transmit or distribute the data contained in this website without the explicit prior written permission of Fusion Media and/or the data provider. All intellectual property rights are reserved by the providers and/or the exchange providing the data contained in this website.
Fusion Media may be compensated by the advertisers that appear on the website, based on your interaction with the advertisements or advertisers.
© 2007-2024 - Fusion Media Limited. All Rights Reserved.