Get 40% Off
🚨 Volatile Markets? Find Hidden Gems for Serious OutperformanceFind Stocks Now

U.S. Stocks At End-Phase Blow-Off Top? Here's How To Tell

Published 11/26/2020, 12:26 AM
Updated 07/09/2023, 06:31 AM

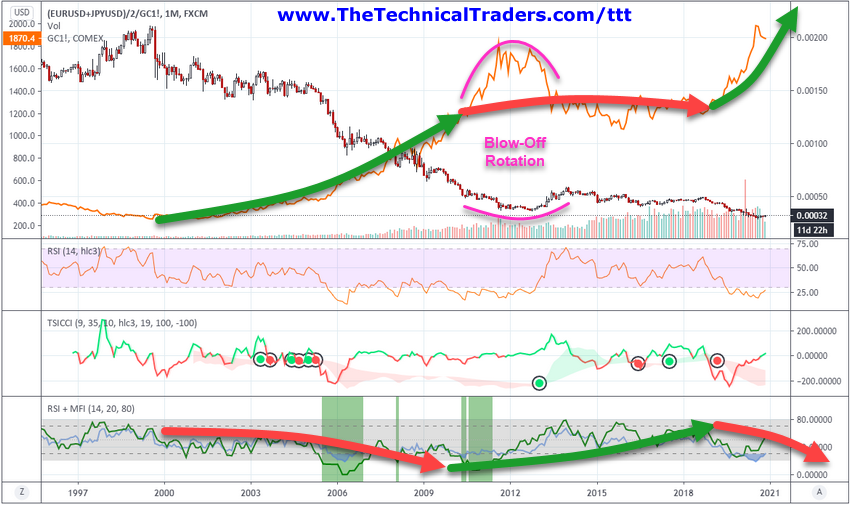
If you have been following my team’s research posts recently, we have highlighted some interesting new research related to Appreciation/Depreciation phases in the US stock market and how that relates to Gold. Today we will explore another method of identifying the different phases of market trends that appears to show very clear Appreciation/Depreciation phases and extended end-phase blow-off tops and bottoms.

My research team and I believe the current rally in the US stock markets represents an end-phase blow-off top after a 9.5-year Appreciation phase that began in mid-2009. We believe it is very important for traders to understand these larger Appreciation/Depreciation cycles and how the Blow-Off end phases often create extreme volatility and price rotation.

Below, we are using a custom EUR/USD/JPY/USD index divided by GOLD as the base Candlestick chart and have applied the real Gold price levels on the chart for visual reference. Near the bottom of the chart, we are showing the RSI indicator, the TSICCI indicator, and the RSI + MFI Indicator that helps to highlight the broad market trends and cycle phases. We want you to pay attention to the GREEN and RED arrows we’ve drawn on this chart showing the Appreciation/Depreciation phases of Gold and the broader US stock markets in EUR/JPY currency form. This method of charting these phases takes a bit of patience and understanding. We are looking for correlations to US stock market trends in relation to precious metals and we must consider the end-phase process.
EUR/USD & JPY/USD Index Divided By GOLD Chart

The end-phase process after any appreciation or depreciation phase often includes a very volatile “blow-off” period where trends continue beyond the end of the actual price phase. This happens because the momentum of the previous price move has yet to realize the transitional shift in underlying appreciation/depreciation factors. Traders still want the rally in the stock market or metals to continue, so they chase after the excess phase rally until the momentum of the move fails.

3rd party Ad. Not an offer or recommendation by Investing.com. See disclosure here or remove ads .

These end-phase excess rallies can be quite exciting and volatile but often end in a certain type of setup. We believe it is important for all traders and investors to understand the end-phase setup and how it translates into opportunities for skilled traders.

LEARN THE COMPONENTS OF AN EXCESS PHASE PEAK/BREAKDOWN

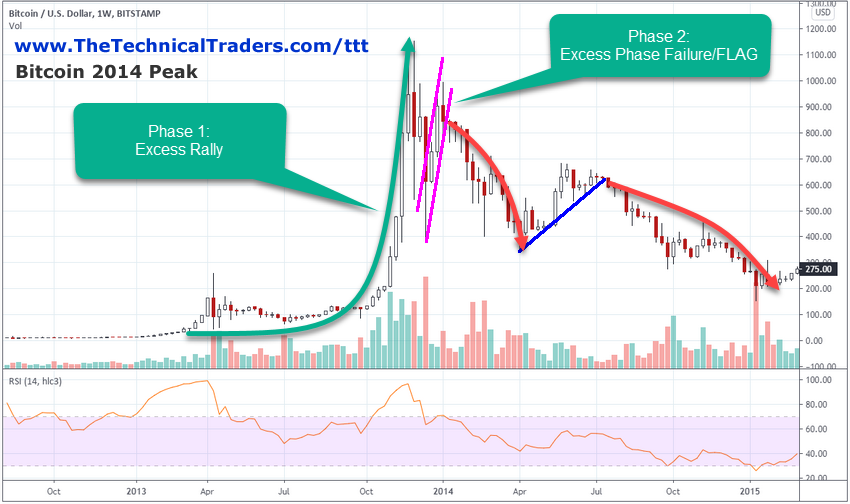
First, the Phase 1 Excess Rally must take place. This is usually an impressive upside price move that may last far longer than many people expect. For example, the 2014 peak in Bitcoin rallied from near $100 to over $1100 (over 1000%), then stalled.

The Second Phase of the Excess Blow-Off peak is the retracement of price followed by a FLAG/Pennant trend that appears to be a resumption of the original trend. This is important from a psychological perspective because it provides further technical price data that the excess rally phase has failed.
Bitcoin Weekly Chart

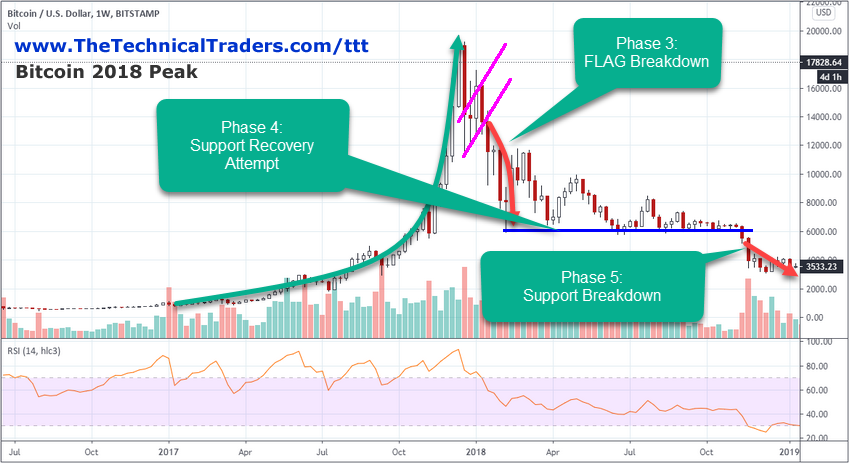
Looking at Phases 3, 4, and 5 on the chart below, we can see the Third Phase is the breakdown of the FLAG formation. When the FLAG formation fails, price usually falls to a new lower support level which sets up the final “exhaustion rally” before stronger selling pressure continues. This is usually a very good trend for short traders. The FLAG setup usually gives traders time to setup Put Options or setup short positions waiting for the breakdown of the FLAG setup.

The Fourth Phase is the identification/setup of the Support/Recovery Attempt. After the FLAG breakdown initiates, price starts to actively seek out fair valuation levels below the Excess Phase peak and the recent FLAG pattern lows. This process usually attempts to identify a near term support level that begins to act as a Price Floor for quite some time.

3rd party Ad. Not an offer or recommendation by Investing.com. See disclosure here or remove ads .

Lastly, the Phase Five Breakdown, as the momentum of the past rally fades and traders resign themselves to the fact that the excitement of the Excess Phase rally has ended. At this point, price usually continues to consolidate near the Phase Four support level before finally breaking downward into the extended downside/bearish trend.
BTC/USD Weekly Chart

As we’ve stated near the top of this research post, our research team believes the current US stock market appreciation phase ended in mid-2018 and that we are nearly 2.5 years into an Excess Phase (blow-off) topping formation. We believe the next phase of the US market trend will be something similar to what we are showing you in these examples. It is important for all traders and investors to recognize these late stage volatile price setups, particularly ones that are pushed to extreme limits because of Central Bank and US Fed interventions.

In Part II of this research article, we’ll share more examples of late Excess Phase peaks and breakdowns as well as share more insight related to the current market conditions. 

Happy Thanksgiving!

Latest comments

Thanks for your comment. Please note that all comments are pending until approved by our moderators. It may therefore take some time before it appears on our website.
My previous comment is pending until approved by your moderators, but this comment immediately posted. Was it nasty word I used in my previous post (Republican)? That what triggered you?
Janet Yellen is going to be our next Treasury Secretary. Her and Jerome Powell are going to get along just fine. With the Republican clown show going on right now in the aftermath of this election, I'm reversing my previous position of believing the Republicans will maintain control of the Senate, and now believe that no longer remains a given. Should the Democrats flip the Senate, then the money is really going to flow, and stocks are going meteoric. Folks can sit on the sidelines if they like, but you won't be scoring any touchdowns while sitting on the bench.
I love the bitcoin example, appreciate your writing.
more doom from Chris. This is not 2008. Market will continue to be pumped higher because of the fed and 'TINA' Short gold if it hits $2000
Good article !  Why will markets go down? Chris  points out many reasons but one seems missing. Treasury intervention into markets.  Treasury owns an account in the Fed called The Exchange Stabilization Fund. This fund is invested under the sole discretion of Mnuchin on behalf of Trump. It is how the markets have been juiced. Using the pandemic as ways to appropriate money Mnuchin has been buying Corporate shares (Preferred).This gives Dow components  extra cash to buy Dow common  stock ,as to look like the markets are healthier than they are. He supposedly just ended this, conveniently when they know there is no hope of winning the election.  Naturally markets are going to  be hesitant for a while. The exchange Stabilization Fund was at about 100 billion  when Trump/Mnuchin came into office ,today it is at over 500 billion. Created cash out of thin air to give a false sense of the health of so called  free markets. Disgusting abuse of unchecked power...,imo.
Yelled did the same under Obama.
You are the one being screwed here, sorry! He is trying to tell about the "psychology" behind market structures, driven by the algo's mainly, and you mix it up with exactly the same bs as has been the case many many times before, before the dotcom bubble, GFC, mid '18, Corona breakdown.
woww! it is mind blowing. thanks Chris.
Your models fail to account for relentless massive 401k _pension purchases & the algos which drive the mkts up, permanently. Plus, as a backstop, the Fed & their proxies (Blackrock etc) crack down & push up any brief 10-20% tanks. Fire your team, son. It's bull party for another 10-20-30 years. The only thing that can crash the stockmarket is if Trump & his shady GOP steal the 2020 election by defying both voters and Democrat Electors from being seated in mid December & on January 6.
Yeah maybe or maybe not. I still remember when I was back in March 2000!! in the US visiting sate street fund managers. Also some other guys. I was persuading them to take profits. I remember CNBC in all gyms and pubs and basically everywhere. 0% of them listened to  me as I was only 24 yo trader, but still they lost 70% of their savings, some of them close to retirement and I made a double on this crash. So what I want to say is be always open to all possibilities and never ever loose your flexibility.
Awesome!!!
Risk Disclosure: Trading in financial instruments and/or cryptocurrencies involves high risks including the risk of losing some, or all, of your investment amount, and may not be suitable for all investors. Prices of cryptocurrencies are extremely volatile and may be affected by external factors such as financial, regulatory or political events. Trading on margin increases the financial risks.
Before deciding to trade in financial instrument or cryptocurrencies you should be fully informed of the risks and costs associated with trading the financial markets, carefully consider your investment objectives, level of experience, and risk appetite, and seek professional advice where needed.
Fusion Media would like to remind you that the data contained in this website is not necessarily real-time nor accurate. The data and prices on the website are not necessarily provided by any market or exchange, but may be provided by market makers, and so prices may not be accurate and may differ from the actual price at any given market, meaning prices are indicative and not appropriate for trading purposes. Fusion Media and any provider of the data contained in this website will not accept liability for any loss or damage as a result of your trading, or your reliance on the information contained within this website.
It is prohibited to use, store, reproduce, display, modify, transmit or distribute the data contained in this website without the explicit prior written permission of Fusion Media and/or the data provider. All intellectual property rights are reserved by the providers and/or the exchange providing the data contained in this website.
Fusion Media may be compensated by the advertisers that appear on the website, based on your interaction with the advertisements or advertisers.
© 2007-2024 - Fusion Media Limited. All Rights Reserved.