Summary: The major US indices all recorded new all-time highs (ATH) this week. The very broad NYSE, covering 2800 stocks, also made a new ATH, suggesting the rally is supported by adequate breadth. Longer-term studies and the fundamental macro data continue to indicate that further upside into year-end is odds-on. Remarkably, a new survey shows that fund managers are the most underweight US equities in 10 years, despite the SPX rising 9 of the last 10 months by an impressive 17%.
On a short-term basis, there are several reasons to be on alert for weakness over the next week or two. An important FOMC meeting is on deck for Wednesday.
* * *
US equities remain in a long term uptrend. SPX, DJIA, NYSE, COMPQ and NDX all made new all-time highs this week.
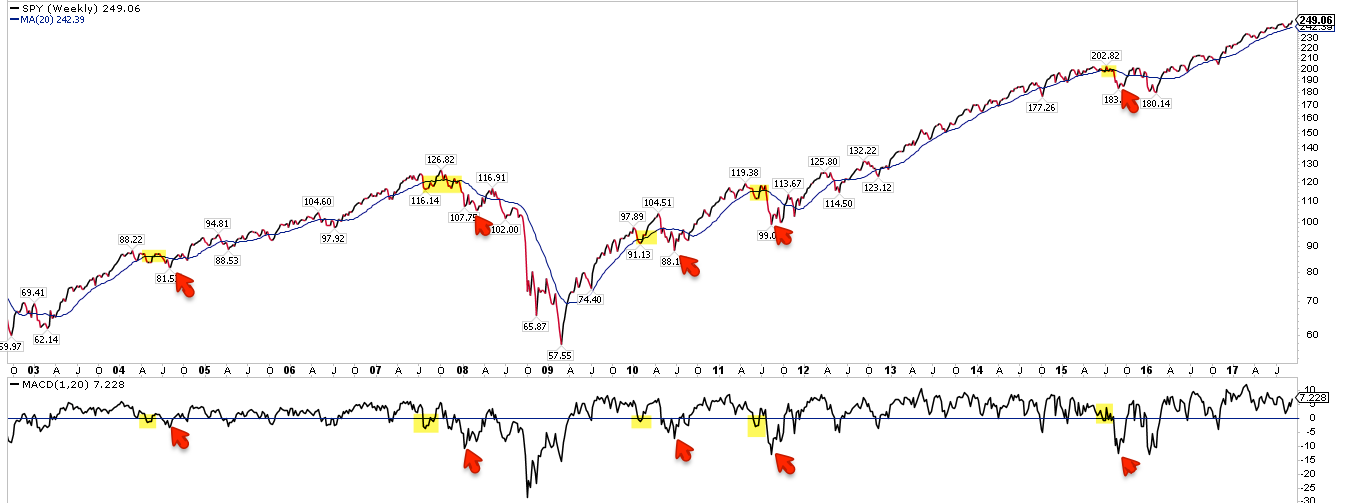
Long-term uptrends typically weaken before they reverse strongly. Note the bottom panel: the 20-wma will flatten in advance of a significant correction to price (yellow shading). This process has not started yet. That doesn't mean that an intermediate-term fall of 5-8% is unlikely; in fact, a correction by that amount is common in most years. But any such fall is likely to followed by a rebound to the prior highs before a more significant correction ensues.
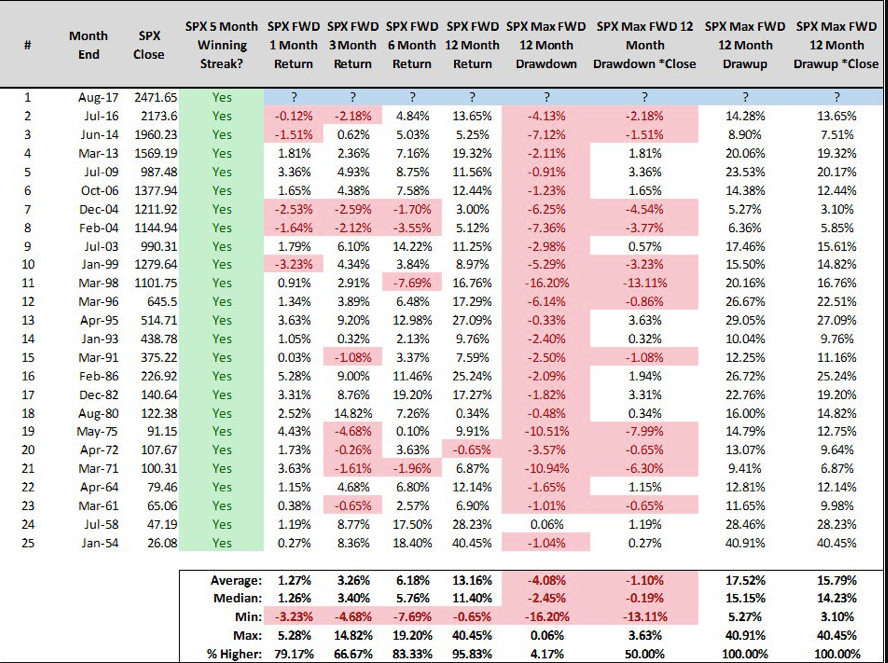
Throughout 2017, we have presented the historical tendency for years with a strong trend, like this one, to rise further. We can add to these the following data: when SPX rises 5 months in a row, as did through August, the index has closed higher after 6 or 12 months every time. The average maximum drawdown during the next year has been a very modest 4% (from @SJD10304).
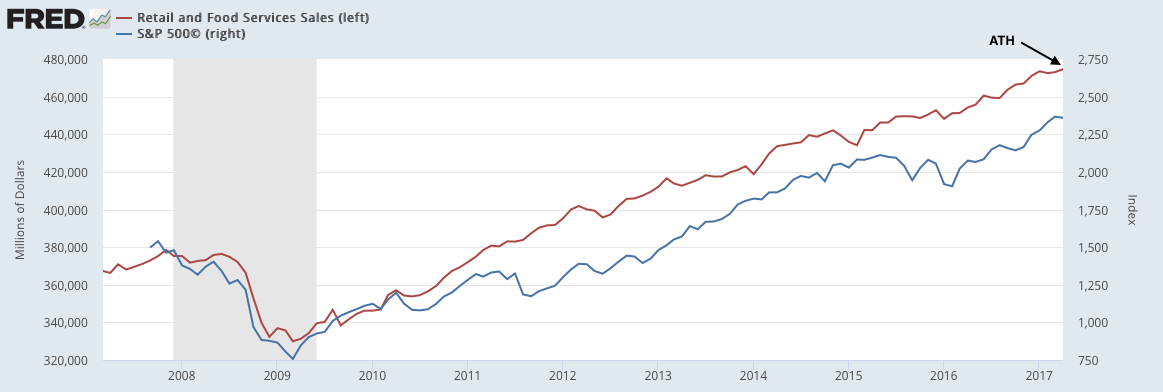
That conclusion is consistent with the fundamental data. Real retail sales reached a new ATH in July with growth approaching 2%. Employment has slowed in the past year, but an average of 175,000 new jobs are still being added each month and unemployment claims continue to fall. On balance, the risk of an imminent recession is minor. This is important as there have been 10 bear markets since the end of World War II but only 2 have occurred outside of an economic recession. A review of the most recent macro data can be found here.
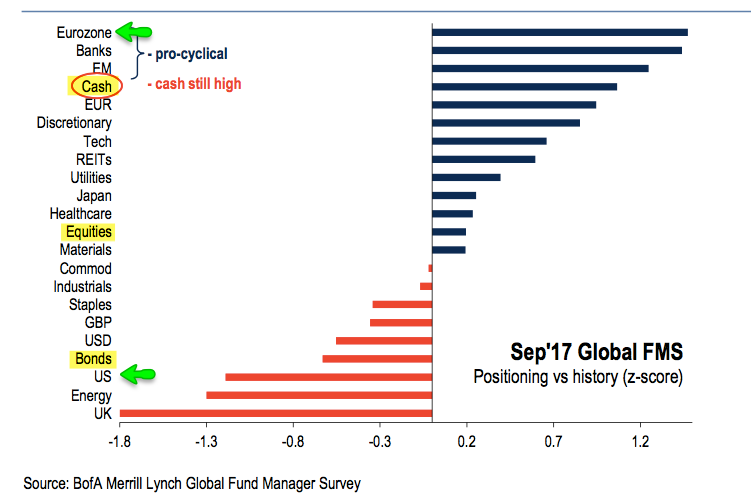
Continued gains in equities is also supported by longer-term measures of sentiment. Investment fund managers surveyed by BAML this month reported relatively high allocations to cash and modest allocations to equities. This combination is consistent with further upside in equity prices. For example, funds hold nearly 5% cash; prior to the 2008 bear market and significant corrections in 2010 and 2011, cash allocations were 3.5% or less. Read a new post on this here.
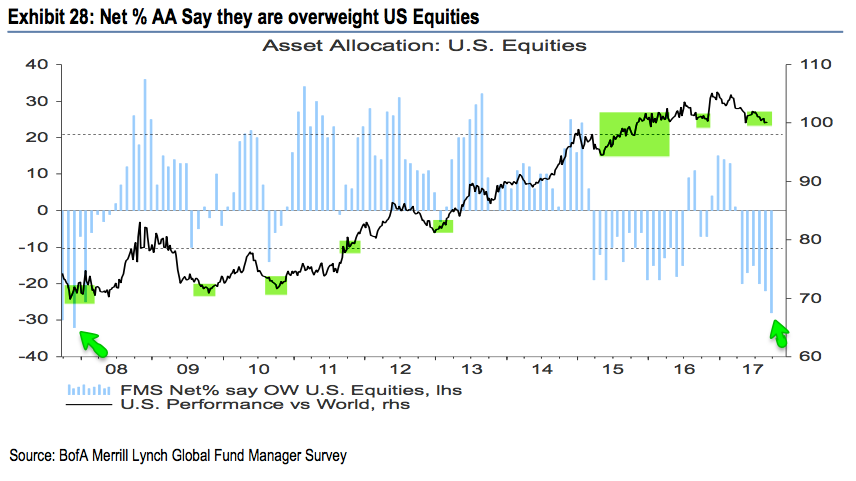
Sentiment towards the US equity market is especially bearish: funds are the most underweight US stocks in 10 years. This is when US equities usually outperform on a relative basis.
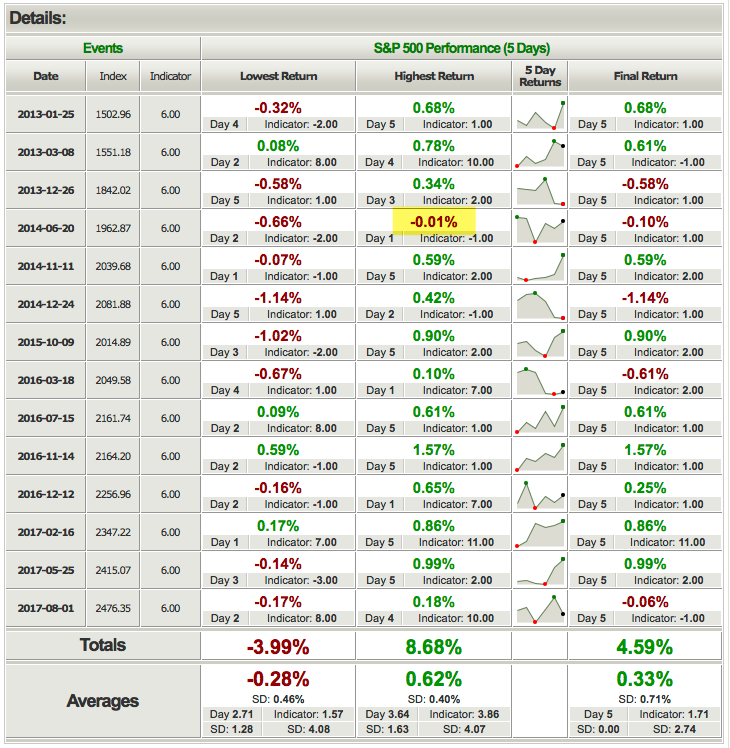
The short-term trend in stocks is also a tailwind into next week. On Friday, the DJIA rose for a 6th day in a row; that momentum tends to carry forward into the days ahead. In the past 5 years, DJIA has risen 6 days in a row 14 other times. Within the next week, the DJIA and the SPX have closed higher 13 of 14 times (93%). The one failure was minor (from indexindicators.com).
There are several other reasons, however, to be on alert for weakness over the next week or two.
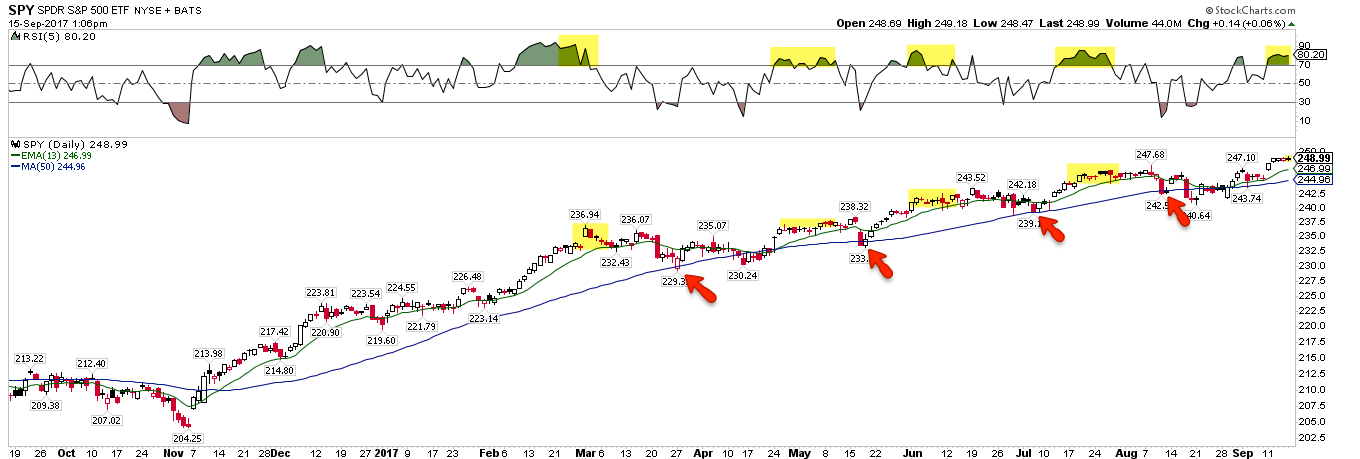
First, since March, the short-term risk/reward has been poor when SPY has been "overbought" on a daily basis (top panel). SPY has tended to chop sideways, with downside about 3 times greater than upside (shading). Through price and time, SPY has ultimately moved to its 50-dma (red arrows). Look for first support (and a positive reaction) at the rising 13-ema (green line).
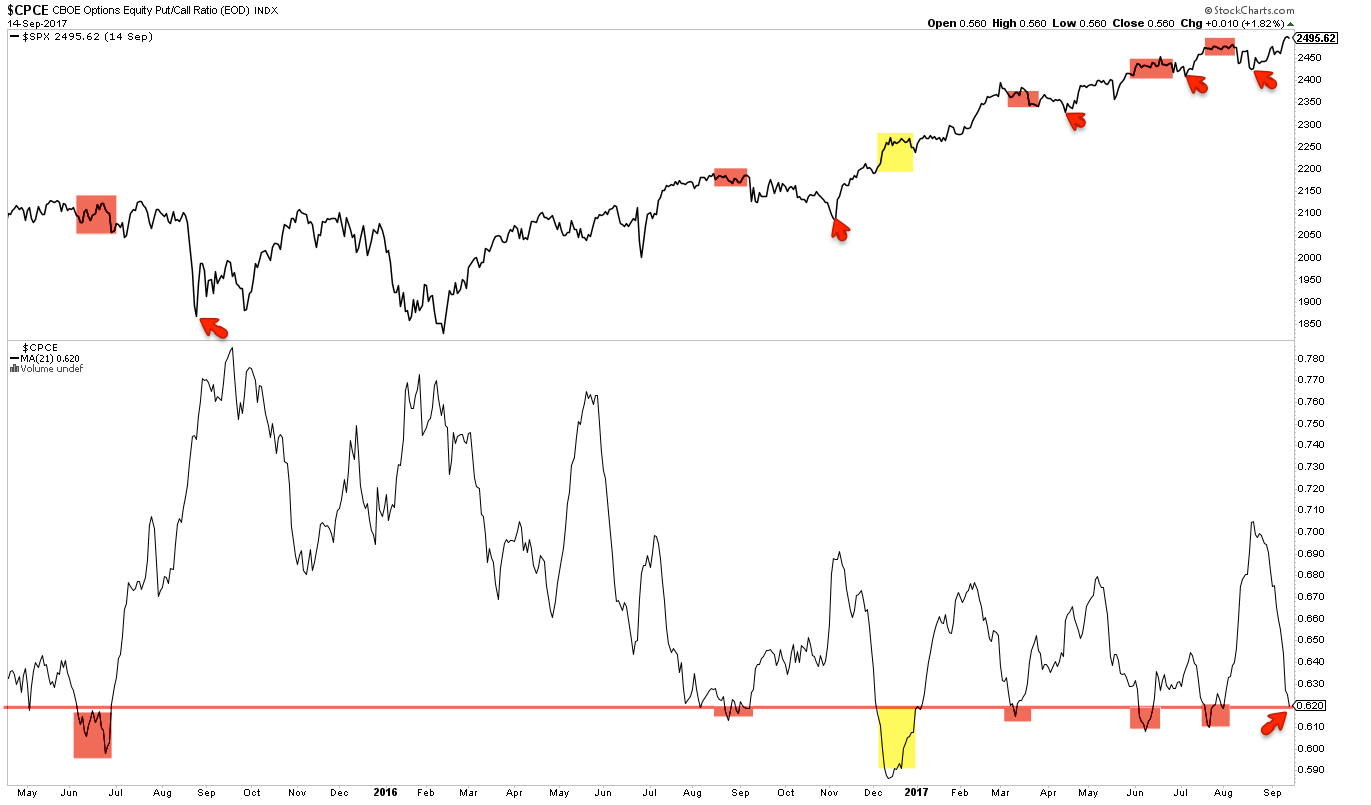
Second, shorter-term measures of sentiment are at a bullish extreme. The one-month average equity-only put/call ratio has reached a level where upside has been minor and and the index has mostly moved lower. Of course, SPY has yet to correct even by 3% in 2017, so downside hasn't been significant. Prior to 2017, current put/call levels had consistently led to downside of at least 3% and often more.
Third, September is seasonally weak in the second half of the month. The upcoming week is the weakest of the year, with SPX closing lower a remarkable 85% of the time since 1990.
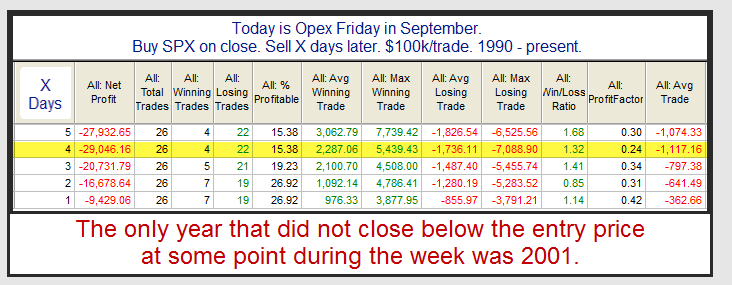
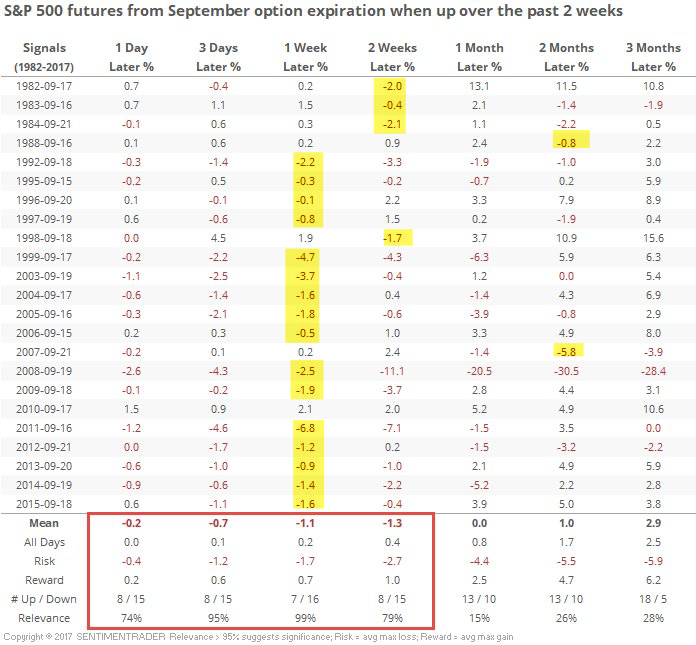
Likewise, when SPX has rallied into September OpX (9/15/17), it has closed lower within the next two weeks 87% of the time, and within the next 2 months 96% of the time, since 1982.
Net, further upside likely lies ahead for US indices into year-end, but there are a number of studies that suggest limited upside and poor short-term risk/reward over the next week or two.
The macro calendar this week is highlighted by an FOMC meeting on Wednesday, during which a balance-sheet unwind may be announced. Housing starts/permits data will be released Tuesday. The week after is data intensive: new home sales (9/26), durable goods (9/27), GDP (9/28) and PCE and quarter end (9/29).

