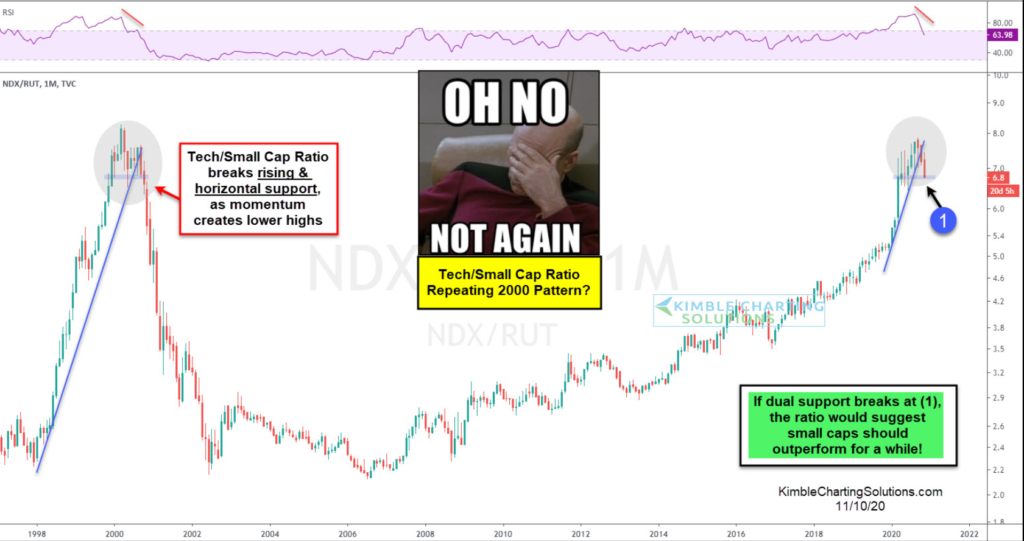
Chris Kimble, a great technician, published this chart yesterday and it tells a story that has been on a lot of investors' minds for some time: when will the mega-cap tech trade end?
The left side of the chart shows the record bear market for the NASDAQ Composite that began in March, declining almost 80% peak-to-trough. The NASDAQ bear market bottomed in October, 2002 and then got close to a re-test of the bottom with the start of the 2nd Gulf / Iraq War in March, 2003.
There is no saying that Tech will repeat that bear market performance, but the mega-cap Tech space could underperform for a while. It’s been leading the market for a number of years.
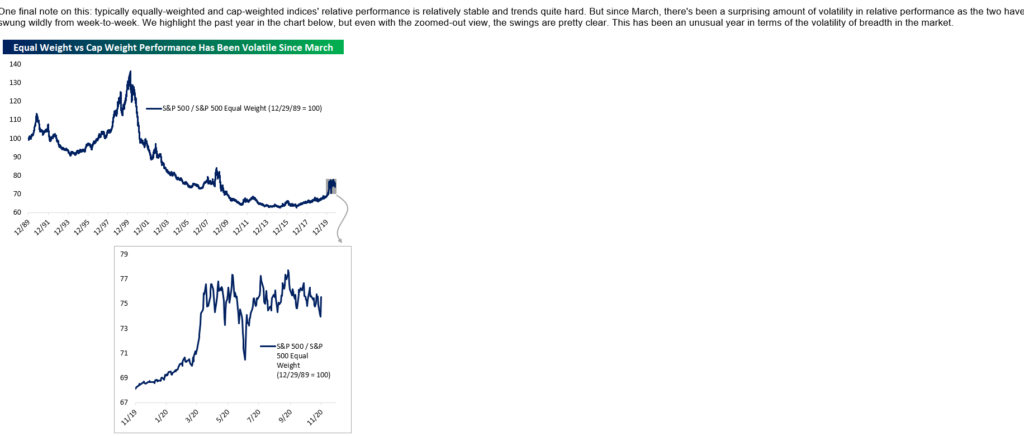
As always, Bespoke put out a number of graphs and tables last week, showing the performance of the S&P 500 vs the S&P “equal-weight” ETF (NYSE:RSP). This is showing a similar pattern to Chris Kimble’s chart above, but what caught my eye and piqued my interest was the “forward returns” table of the RSP.

This graph from Bespoke showed the diverging breadth last week for the S&P 500 vs the RSP.

It’s clear from this table there is an “alpha” premium from owning RSP vs SPX over the next twelve months.

This third graph was part of the post from Bespoke, so I added it for readers, but the important data is in the middle of the top and bottom graphs and shows that market-cap weighted vs equal-weighted underperforms significantly after a day of breadth performance like last Thursday, November 6th.
Summary / conclusion:
A contested election on December 14th, or a new lockdown in the US could significantly change the above, so take everything here with a grain of salt. However use it as a guide too—if the US stock market remains well bid, then we could probably expect, given the Bespoke data, that small and mid-cap could outperform the next year, while it’s pretty clear that the RSP should materially outperform.
We started to prepare for this kind of rotation last summer when the mega-cap tech and stay-at-home stocks were on a one-way rocket ship northeast, as was written about here and here.
Clients have seen the RSP and iShares Russell 2000 ETF (NYSE:IWM) (as well as Vanguard FTSE Emerging Markets Index Fund ETF Shares (NYSE:VWO)) added to accounts gradually the last few months, particularly in taxable accounts given the size of the gains in mega-cap Tech. Clients love big gains until they see their tax bill from capital gains.
It’s a calculated guess right now, but “alpha” or market outperformance could come from significantly different asset classes in 2021. Just don’t be caught off guard.
The credit markets remain in good shape. That’s a plus.
