Forex News and Events
Markets do not support a September rate hike
Today will be released the retail sales data for July. Estimates report a change increase of 0.6% from -0.3% in June, mostly driven by strong vehicle sales. Initial jobless claims (new people filing for unemployment benefits) will also be coming in today. This data is expected to remain in line with the prior figure at 270K. Last week, non-farm payroll report printed lower than expected at 215k vs 225k. We are still thinking that data are not fully supporting a September rate hike. In addition, the yuan devaluation is likely to prevent the Fed to act on its monetary policy. Indeed, how can, in a slow growth environment, the US increase its rates when other countries throughout the world debase their currency?
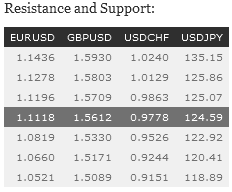
Furthermore, when looking at the US 10-year bonds, yields have decreased by 35 basis points from their June peak, while the 2-year yields have decreased by less than 30 basis points during the same period. In other words, the yield curve is flattening as investors are reducing their growth and inflation expectations. Therefore, we think that markets are now betting that no rate hike will happen next month. The EUR/USD has been mostly driven by the Greek third bail-out over the last few days. Besides, the pair has surged to a monthly high. We target resistance at 1.1278 on diminishing odds that a September rate hike will happen.
Swiss Disinflation Dynamics Remain
What was not really a big shock Swiss Producer and Import price index fell according to the Swiss Federal Statistical Office. The Producer and Import prices index m/m fell by -0.3% to 91.3, y/y collapsed to -6.4% against -6.3% expected read. Producer prices index for domestically produced goods slid -0.2% and import price index declined -0.3%. The read clearly indicates that deflationary dynamics remains entrenched in Switzerland and last month’s subdued read was likely a one-off. The SPO press release stated that the fall came from a decline in “petrol and petroleum products as well as for watches and electronic components and circuit boards.” Given the macro backdrop, energy prices are unlikely to increase in the near further, while fall in exports is due to lack of CHF competitiveness.
This data indicates that the SNB will have to remain vigilance as disinflation pressure materialize. CHF should further depreciate against EUR and USD as markets anticipate further economic weakness and increased probably of SNB easing monetary policy further (less likely direct fx intervention). With EUR/CHF organically trading above post-SNB action February highs, the need for the central bank to intervene in FX prices has diminished considerably. However, SNB vice-president Fitz Zurbruegg repeated the SNB's commitment to modest intervention should the conditions warrant. Traders will continue to still see the SNB's hand in every unruly EUR/CHF movement, and scour sight deports for evidence of activity. Therefore, indirectly providing downward pressure on CHF. In addition, there is growing evidence that foreign inflows due to risk aversions (heavy in the 1H 2014-2015) are starting to unwind.
Finally, considering the divergence of central bank’s monetary policy we anticipate that the CHF will be one of the worst G10 performers in the final months of 2015. Selling CHF remains one of the purest play for monetary policy divergent theme.
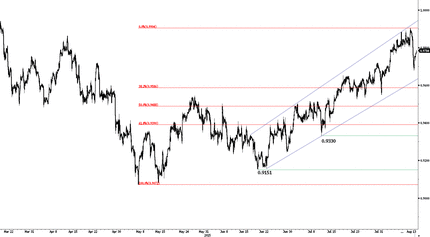
USD/CHF - Following the Uptrend Channel

Today's Key Issues Country / GMT ECB Account of the Monetary Policy Meeting EUR / 11:30 Jul Retail Sales Advance MoM, exp 0.60%, last -0.30% USD / 12:30 Jul Retail Sales Ex Auto MoM, exp 0.40%, last -0.10% USD / 12:30 Jul Retail Sales Ex Auto and Gas, exp 0.40%, last -0.20% USD / 12:30 Jun New Housing Price Index MoM, exp 0.10%, last 0.20% CAD / 12:30 Jul Retail Sales Control Group, exp 0.50%, last -0.10% USD / 12:30 Jun New Housing Price Index YoY, last 1.20% CAD / 12:30 Jul Import Price Index MoM, exp -1.20%, last -0.10% USD / 12:30 Jul Import Price Index YoY, exp -10.70%, last -10.00% USD / 12:30 Aug 8 Initial Jobless Claims, exp 270K, last 270K USD / 12:30 Aug 1 Continuing Claims, exp 2245K, last 2255K USD / 12:30 Bloomberg Aug. United States Economic Survey USD / 12:45 Aug 9 Bloomberg Consumer Comfort, last 40.3 USD / 13:45 Jun Business Inventories, exp 0.30%, last 0.30% USD / 14:00 2Q MBA Mortgage Foreclosures, last 2.22% USD / 22:00 2Q Mortgage Delinquencies, last 5.54% USD / 22:00 Jun Economic Activity MoM, exp -0.50%, last 0.03% BRL / 22:00 Jun Economic Activity YoY, exp -1.45%, last -4.75% BRL / 22:00
The Risk Today
EUR/USD EUR/USD has broken resistance at 1.1045 (declining channel). Over the last month, the pair is still setting lower highs; therefore, we remain bearish over the medium-term. Hourly resistance lies at 1.1278 (29/06/2015 high). Stronger resistance lies at 1.1436 (18/06/2015 high). Support can be found at 1.0660 (21/04/2015 low). In the longer term, the symmetrical triangle from 2010-2014 favors further weakness towards parity. As a result, we view the recent sideways moves as a pause in an underlying declining trend. Key supports can be found at 1.0504 (21/03/2003 low) and 1.0000 (psychological support). Break to the upside would suggest a test of resistance at 1.1534 (03/02/2015 reaction high).
GBP/USD GBP/USD has shifted into a consolidation pattern after slight bullish recovery. However, drift lower indicates persistent selling pressure. Stronger support is given at the 38.2% Fibonacci retracement at 1.5409. Hourly resistance is given at 1.5733 (01/07/2015 high). We remain bearish on the pair. In the longer term, the technical structure looks like a recovery bottom whose maximum upside potential is given by the strong resistance at 1.6189 (Fibo 61% entrancement).
USD/JPY USD/JPY continues to recover after its recent sell-off. The pair is oriented upward. In addition, the road is still wide open towards the stronger resistance at 125.86 (05/06/2015 high). Hourly support is given by the 38.2% Fibonacci retracement at 122.04. A long-term bullish bias is favored as long as the strong support at 115.57 (16/12/2014 low) holds. A gradual rise towards the major resistance at 135.15 (01/02/2002 high) is favored. A key support can be found at 118.18 (16/02/2015 low).
USD/CHF USD/CHF has declined below 0.9800, suggesting persistent selling pressures. (13/04/2015 high). Nonetheless, the pair still remains in a short-term upside momentum. Hourly support can be found at 0.9151 (18/06/2015 low). In the long-term, there is no sign to suggest the end of the current downtrend after failure to break above 0.9448 and reinstate bullish trend. As a result, the current weakness is seen as a counter-trend move. Key support can be found 0.8986 (30/01/2015 low).

