
Markets continued to trade in a risk-on manner on Thursday and today in Asia, as investors seem to have continued to cheer US President Biden’s infrastructure plan. The upside revisions in the Markit manufacturing PMIs and the better-than-expected ISM index in the US may have also helped. As for today, it is Good Friday in most nations under our radar and thus, the respective markets will be closed. However, we do get the US employment report for March.
US Dollar Slides, Equities Gain Ahead Of The US Employment Report
The US dollar traded lower against all but one of the other G10 currencies on Thursday and during the Asian session Friday. It lost the most ground versus NZD and AUD, while it was found virtually unchanged against JPY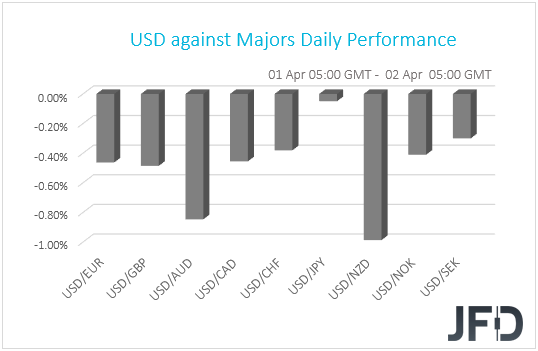
The weakness in the US dollar and the Japanese yen, combined with the strengthening of the risk-linked Aussie and Kiwi, suggests that markets continued trading in a risk-on fashion. Indeed, turning our gaze to the equity world, we see that most major EU indices closed in the green, with the only exception being Spain’s IBEX 35, which closed virtually unchanged.
Investors’ appetite was boosted even further, with NASDAQ gaining the most among Wall Street’s main indices and the S&P 500 hitting a fresh record high, surpassing the round figure of 4000. The positive morale rolled over into the Asian session today as well.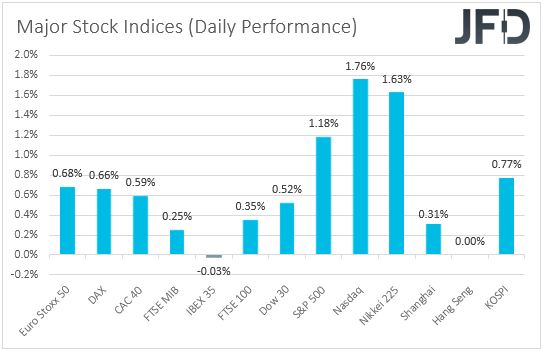
It seems that investors continued to cheer US President Biden’s proposal of a USD 2.3trln worth of infrastructure investments, but they may have also got encouraged to add to their risk exposure by the upside revisions in the final Markit manufacturing PMIs for March from the Eurozone, the UK, and the US. On top of that, in the US, the ISM manufacturing index for the month rose to 59.6 from 54.4, which is the strongest level in more than 37 years.
As for today, all lights are likely to fall on the US employment report for March. The forecast for nonfarm payrolls has changed and now points to a 647k new jobs, more than the 379k in February. The unemployment rate is anticipated to have declined to 6.0% from 6.2%, while average hourly earnings are forecast to have slowed to +0.1% mom from +0.2%, something that would take the yoy rate down to +4.5% from +5.3%.
The forecasts point to a strong report, which is likely to confirm that the US economy is recovering from the damages of the pandemic at a fast pace. This is likely to support the US dollar at the time of the release. However, the big question is how equities will perform when they open again on Tuesday. Today, stock markets across most of the nations under our radar will be closed due to the celebrations of Good Friday and will remain closed on Monday due to Easter Monday. In our view, how equities will perform depends on whether the report would revive inflation fears, which could lead to speculation that the Fed may start normalizing policy sooner than previously expected.
If not, equities and other risk-linked assets are likely to gain, while safe havens, like the yen, are likely to come under selling interest. On the other hand, fresh inflation fears may result in the opposite market reaction. As for our view, we believe that the first case may be true as the Fed has clearly said that any spike in inflation in the months to come is likely to prove to be temporary, and that inflation will meet their goal in the years after 2023. Remember that at the press conference following the latest FOMC gathering, Fed Chair Powell also noted that it is too early to start discussing tapering QE, while the updated dot plot pointed to no rate hikes even in 2023.
Now back to the US dollar, we believe that it is safer to exploit any gains of it against the Japanese yen. On the one hand, improving risk appetite is likely to weigh on the yen due to its safe-haven status, while on the other one, the yen could stay under selling interest even if the employment report revive fresh inflation fears. Why? This may result in higher US Treasury yields, which combined with a BoJ pledged to keep its long-dated JGB yields near zero, will widen the yield differential between the two nations, thereby pushing USD/JPY higher.
NIKKEI 225 Technical Outlook
Nikkei 225 continues to balance above a medium-term upside support line drawn from the low of Nov.13. Also, yesterday, the index managed to overcome last week’s high, at 29633. The oscillators started pointing higher, which supports the upside scenario, at least in the near term. For now, we will take a positive approach.
A further push north could bring the index to its next possible resistance area, at 30050, marked near the highs of Mar. 17 and 19. Initially, the area might halt the uprise, but if the buyers are still feeling strong, they might easily drive Nikkei 225 to the 30495 hurdle, or to the 30717 level, marked by the current highest point of this year.
Alternatively, if the index breaks the aforementioned upside line and then falls below the low of this week, that might spook new buyers from entering for a while. Nikkei 225 could drift to the next key support area, at 28285, marked by the lowest point of March. The price may rebound somewhat, however, if the index is not able to get back above the previously mentioned upside line, it could easily revers south again. If this time Nikkei 225 is able to break the 28285 obstacle, the next potential target could be at 27580 level, marked by the lowest point of February.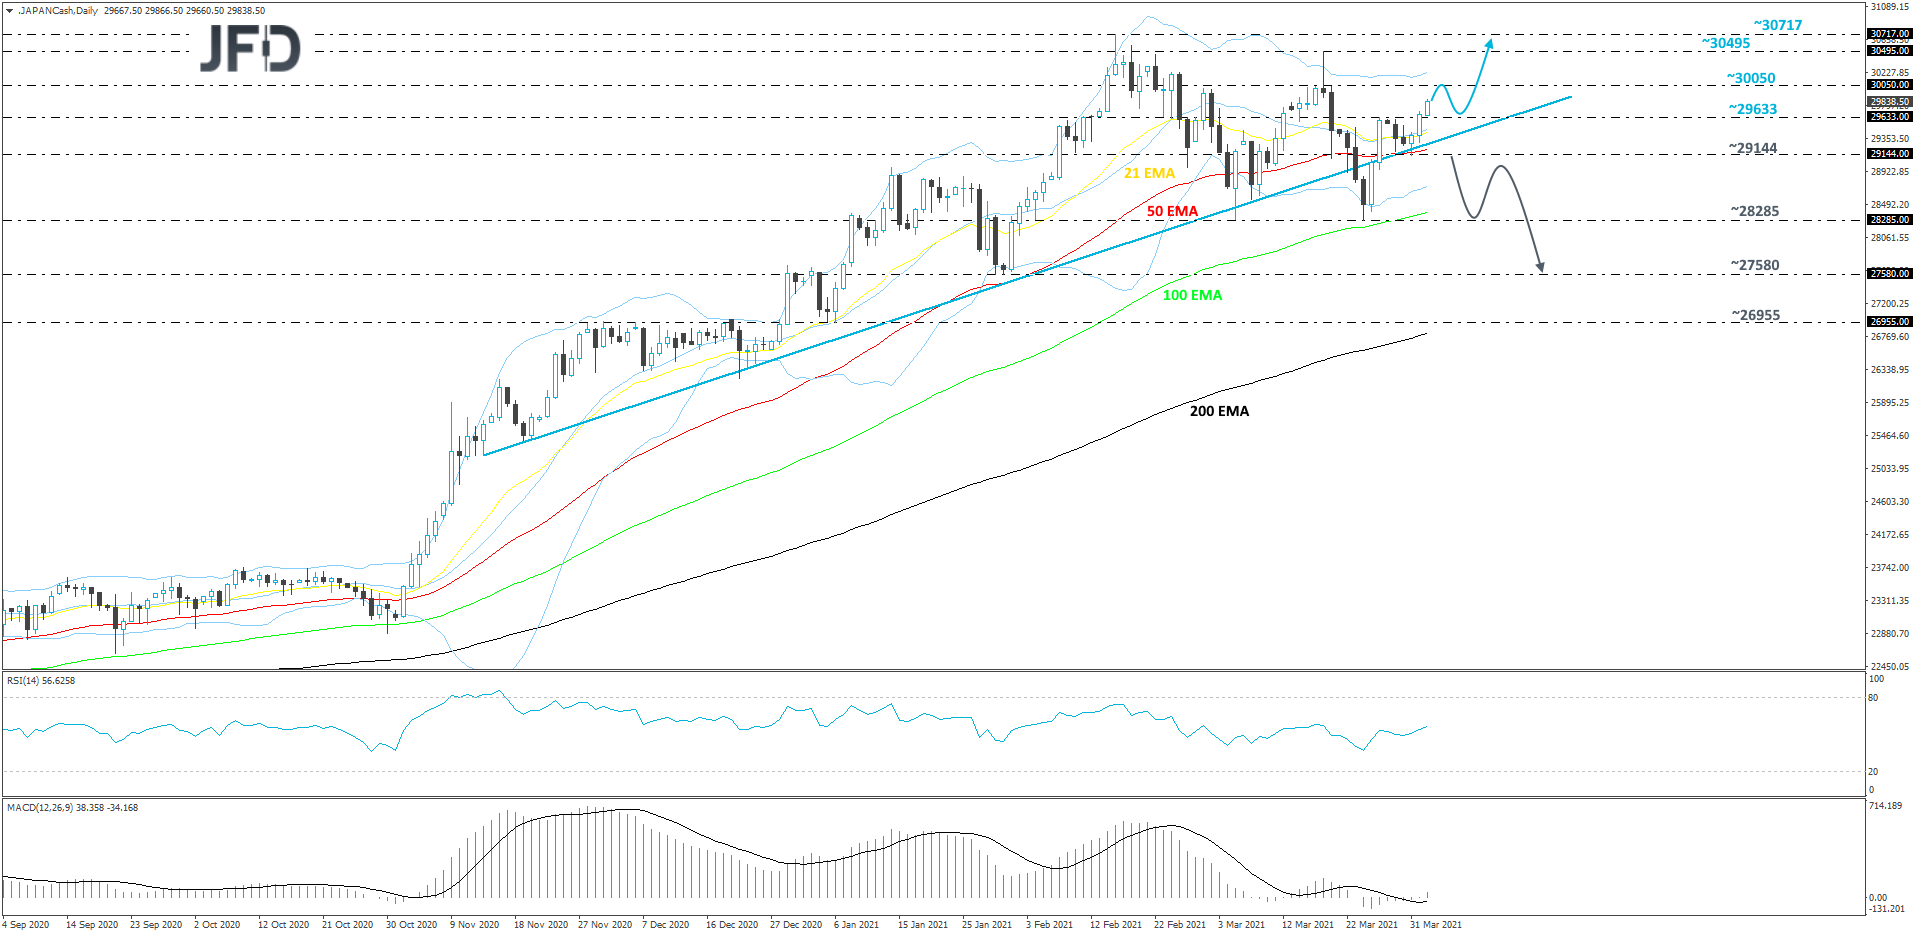
USD/JPY Technical Outlook
USD/JPY has been moving sideways for the last couple of days, but still remains above a short-term tentative upside support line taken from the low of Feb. 23. Even if the pair retraces slightly lower, as long as it stays above that line, we will remain positive with the near-term outlook.
If the rate drops below the 110.42 hurdle, marked near the high of March 30th and near an intraday swing low of Mar. 31, that could open the door for a move lower, possibly bringing the pair closer to the aforementioned upside line. If that line provides support, this move lower could be classed as a temporary correction, before another possible drift higher. If USD/JPY is able to get back above the 110.42 hurdle, it could then rise to the current highest point of this week, at 110.96, a break of which would confirm a forthcoming higher high and set the stage for a move further north. That’s when we will aim for the 111.71 level, marked by the highest point of March 2020.
On the other hand, if the previously-mentioned upside line breaks and the rate falls below the 109.37 zone, marked by the low of Mar. 29, that may spook the remaining bulls from the field. More bears might join in and drive USD/JPY to the 108.95 area, marked near the highs of Mar. 22 and 24. If the slide continues, the next potential target may be between the 108.32 and 108.40 levels, marked by the lows of Mar. 10 and 23.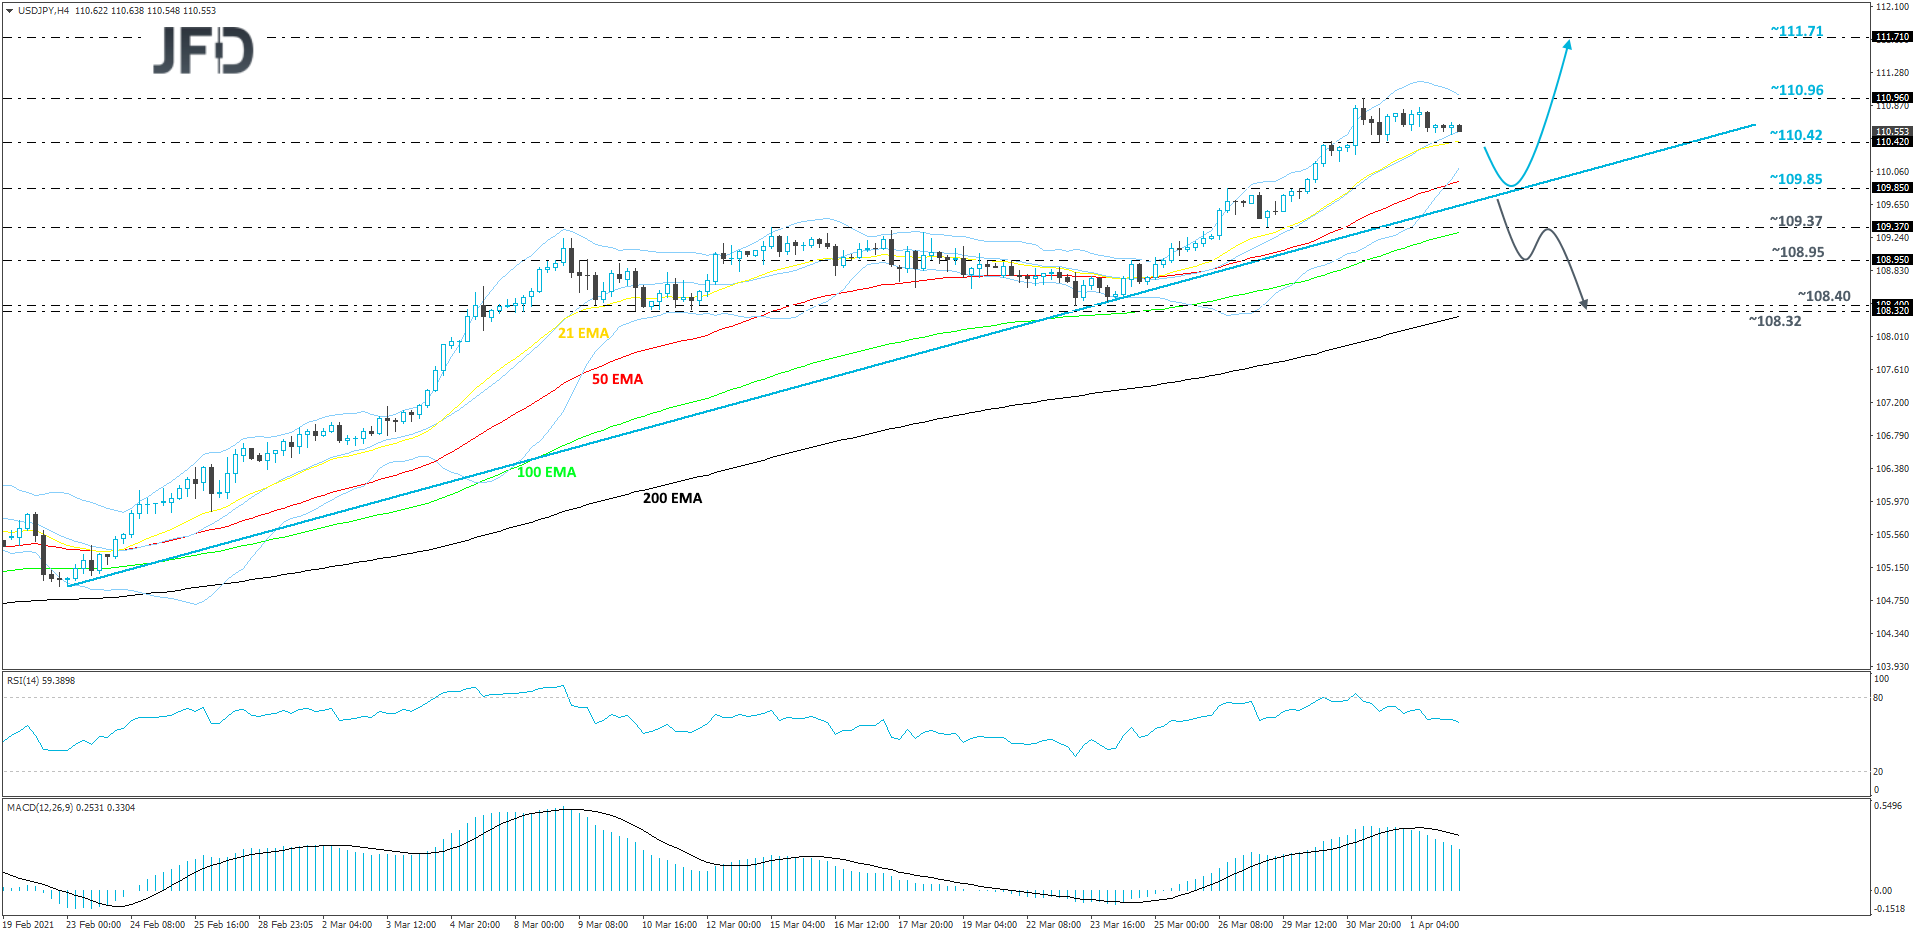
AS For The Rest Of Today's Events
As we already noted, today is Good Friday in most nations under our radar and so there are no other economic releases on the agenda. We only have one speaker and this is Atlanta Fed President Raphael Bostic.