Get 40% Off
👀 👁 🧿 All eyes on Biogen, up +4,56% after posting earnings. Our AI picked it in March 2024.
Which stocks will surge next?
Unlock AI-picked Stocks

U.S. Markets: On The Cusp Of Chaos

Published 10/11/2018, 12:12 AM
Updated 07/09/2023, 06:31 AM

Further to my observations outlined in my posts of August 6 (where I noted that 2900 represented a major Fibonacci resistance level for the SPX), the end of September (where I mentioned the possibility of equity weakness for the first part of Q4 ahead of the November 6 mid-term elections), and October 7 (where I discussed price on four of the Major Indices being embroiled in a technical chaos formation amid downside accelerating rate-of-change), I'd note that after yesterday's dramatic drop in U.S. markets, they are now sitting on or close to near-term major support, as shown on the following daily charts of the nine Major Indices.

US Major Indices Daily

Most of them are still hanging onto some of their year-to-date percentage gains, as shown on the first graph below...but have lost a hefty percentage in the past week, as shown on the second graph.

US Major Indices: Year-To-Date Percentage Gains
US Major Indices: Losses, Past Week

Price on the SPX:VIX ratio has fallen well below both the 200 New Bull Market level and the 150 Bull/Bear Line-in-the-Sand level, as shown on the following daily ratio chart.

All three technical indicators have sunk below their respective neutral levels (50 for the RSI and zero for the MACD and PMO) and are accelerating to the downside, hinting of further weakness ahead for the SPX.
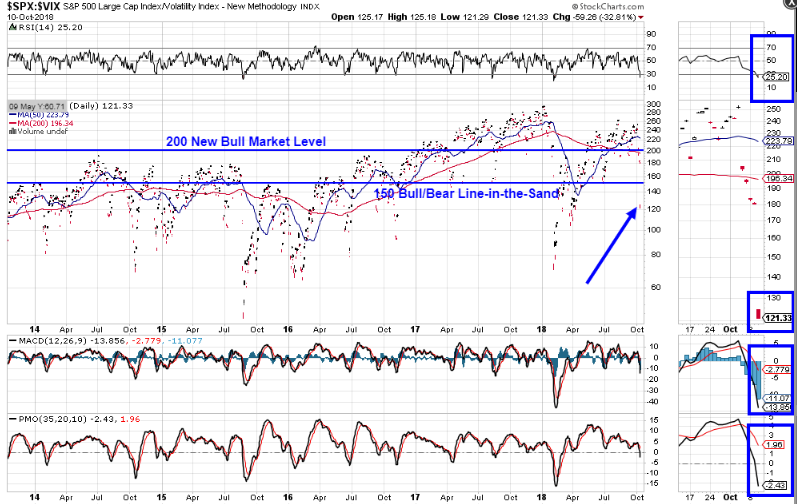
SPX-VIX Chart

As can be noted on the following monthly chart of the SPX, longer-term major support sits around the 2600 level...a convergence of price support and a long-term median of an uptrending Andrew's Pitchfork formation.

As the SPX made a new all-time high on this timeframe, the momentum and rate-of-change technical indicators did not. In fact, both of these have made a lower swing low and the ROC is now below zero...also hinting of further weakness ahead.

3rd party Ad. Not an offer or recommendation by Investing.com. See disclosure here or remove ads .

Keep an eye on these latest indicators, together with those identified in my above three posts, for short and longer-term gauges of either further weakness, or a turnaround any time soon.
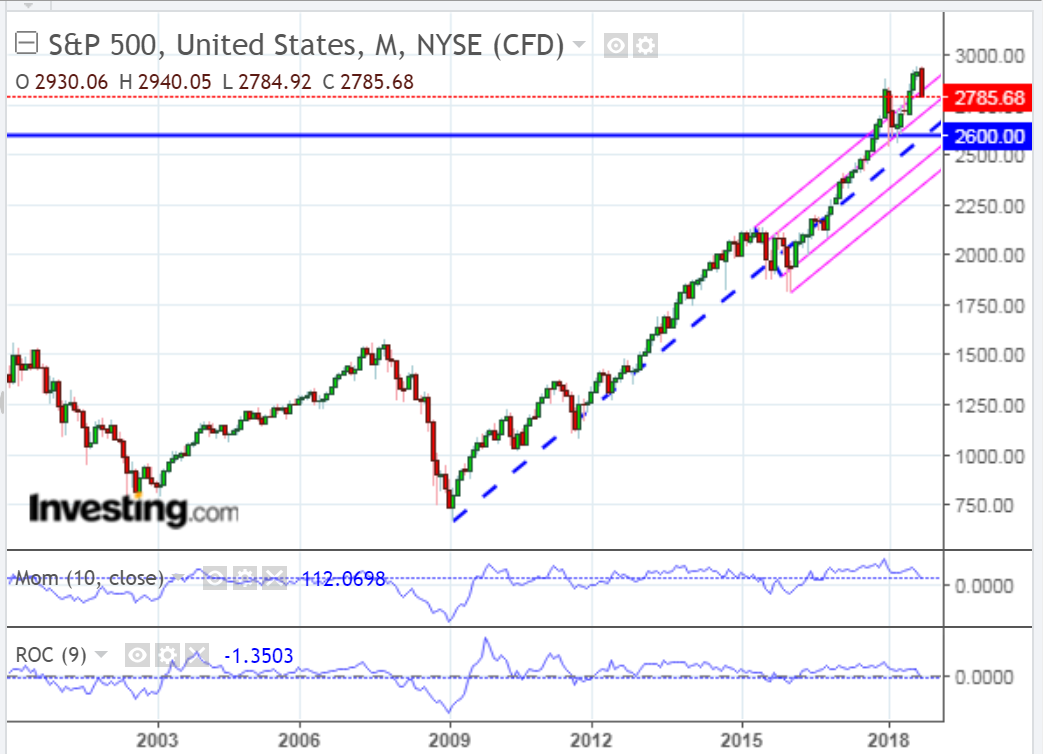
S&P 500 Monthly 2000-2018

Latest comments

Risk Disclosure: Trading in financial instruments and/or cryptocurrencies involves high risks including the risk of losing some, or all, of your investment amount, and may not be suitable for all investors. Prices of cryptocurrencies are extremely volatile and may be affected by external factors such as financial, regulatory or political events. Trading on margin increases the financial risks.
Before deciding to trade in financial instrument or cryptocurrencies you should be fully informed of the risks and costs associated with trading the financial markets, carefully consider your investment objectives, level of experience, and risk appetite, and seek professional advice where needed.
Fusion Media would like to remind you that the data contained in this website is not necessarily real-time nor accurate. The data and prices on the website are not necessarily provided by any market or exchange, but may be provided by market makers, and so prices may not be accurate and may differ from the actual price at any given market, meaning prices are indicative and not appropriate for trading purposes. Fusion Media and any provider of the data contained in this website will not accept liability for any loss or damage as a result of your trading, or your reliance on the information contained within this website.
It is prohibited to use, store, reproduce, display, modify, transmit or distribute the data contained in this website without the explicit prior written permission of Fusion Media and/or the data provider. All intellectual property rights are reserved by the providers and/or the exchange providing the data contained in this website.
Fusion Media may be compensated by the advertisers that appear on the website, based on your interaction with the advertisements or advertisers.
© 2007-2024 - Fusion Media Limited. All Rights Reserved.