Risk aversion on trade tensions carried into the European session yesterday morning was replaced with a relief rally in the US pre-market as President Trump appeared to go easy on China and its ability to invest in the US. The President signaled that the CFIUS would regulate investments into the US which the markets took to be a softening of his position. US Stock markets rallied to the day’s highs posting the biggest daily gains since February with the US 30 up from 24284.00 to 24570.00, while in FX USD/JPY gained from 109.969 to 110.486. But Chief Economic Advisor Kudlow reignited the fear of a hard-line approach when he said that “Trump is not retreating on China”. This wiped out all of the gains as the markets reacted to the headline, with the US 30 closing at 24117.59 down -0.7% and GBP/USD falling to the 113.000 level as the dollar strengthened throughout the day.
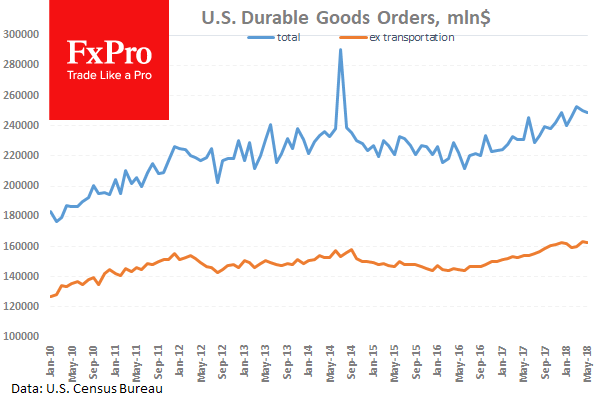
US Durable Goods Orders ex Transportation (May) were -0.3% against an expected 0.5% from 0.9% previously which was revised up to 1.9%. Durable Goods Orders (May) were -0.6% against an expected -1.0% against -1.6% previously which was revised up from -1.7% and with the release of the data was against revised up to -1.0%. This data fell under 0% last month and stayed below this mark but came in higher than the previous reading. The ex-transports data missed its forecast and came in lower than the previous reading. This shows a slowing in quantity of orders placed. USD/JPY went higher from 110.162 to 110.486 after this data release.

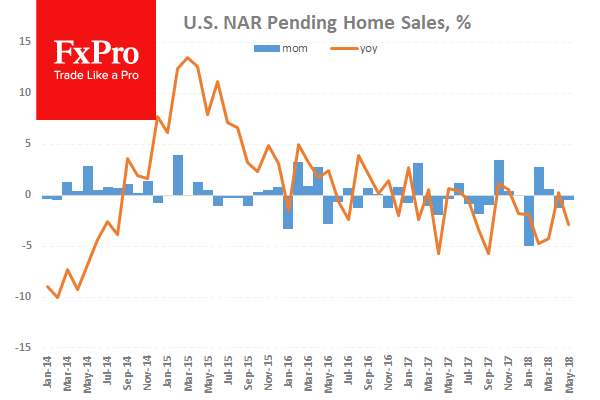
Pending Home Sales (MoM) (May) were -0.5% against an expected 0.5% from a prior reading of -1.3%. This data points missed expectations but came in higher than the previous reading. The data is expected to turn back above zero today but remains under that mark. This is in-line with the pattern from last year and if this is followed, next month should see a stronger performance. EUR/USD fell from 116.112 to 115.749 following this data release.

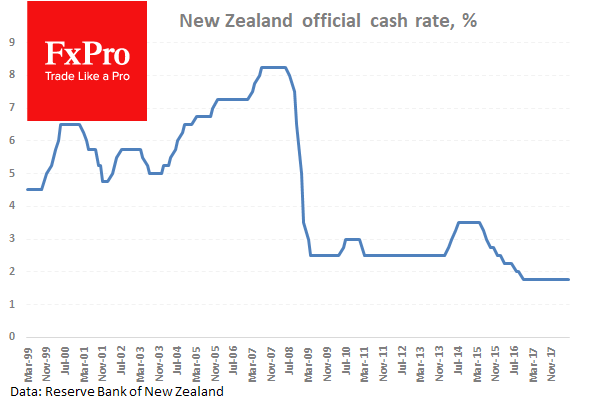
New Zealand Interest Rate Decision was released with the RBNZ keeping rates unchanged at 1.75%. The Rate Statement was also released at this time. In the statement the Bank said that they are well positioned to respond to any eventuality with the next rate move either up or down. They commented that the outlook has been tempered slightly by trade tensions. NZD/USD moved higher from 0.67779 to 0.68078 after the announcement.

EUR/USD is unchanged overnight, trading around 1.15552.
USD/JPY is up 0.03% in the early session, trading at around 110.290
GBP/USD is down -0.17% this morning trading around 1.30890
Gold is down -0.04% in early morning trading at around $1,252.50
WTI is up 0.07% this morning, trading around $71.79
For more in-depth analysis and market forecasts visit our FxPro Blog.
