Get 40% Off
⚠ Earnings Alert! Which stocks are poised to surge?
See the stocks on our ProPicks radar. These strategies gained 19.7% year-to-date.
Unlock full list

U.S. Indices In Correction Territory On Unprecedented Volatility

Published 02/09/2018, 12:40 AM
Updated 07/09/2023, 06:31 AM

After another volatile day of trading on Thursday, all of the nine US Major Indices closed down hard and four are officially now in 10% correction territory (with the others closely behind), as shown on the following graph, which shows their losses since prices peaked in January.

US Major Indices


Here's a look at their 6-month daily chart. All of them are below their 50-day moving average.

6-Month Daily Chart


The following monthly chart of the SPX:VIX ratio shows that the trading range of February's candle is the largest, in history, after only 6 trading days. Price has now entered into the "uncommitted zone" and is hovering just above the "fragile zone." Historically, price action on the SPX consists of wild, aimless/trendless and very volatile swings when this ratio remains below 150.
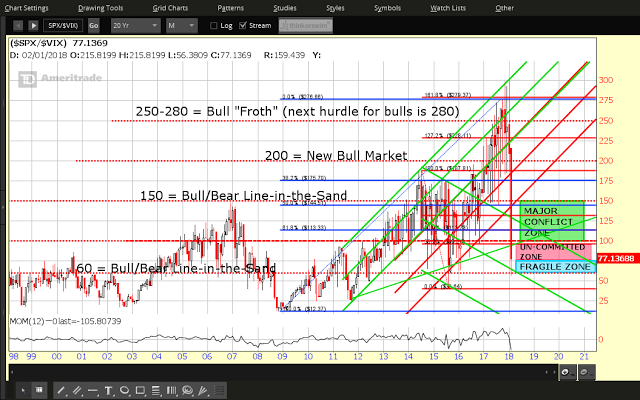
SPX:VIX ratio


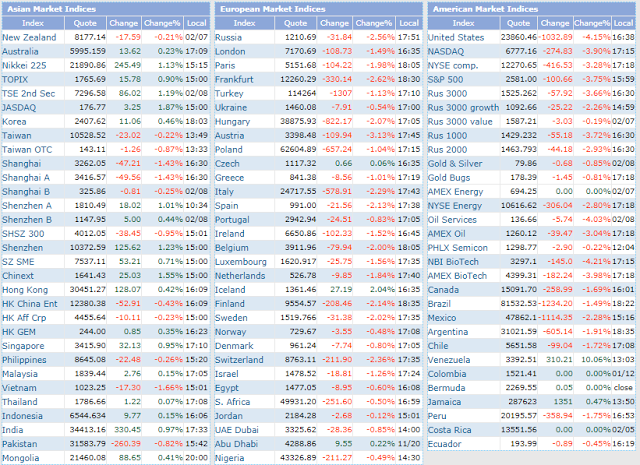
World Markets, in general had a bad day on Thursday, as can be seen from the graphics below.
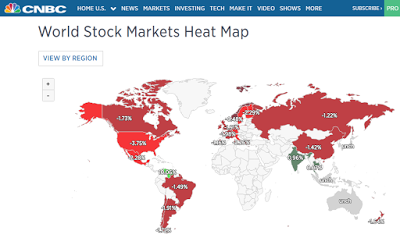
World Stock Markets Heat Map

Market Indices

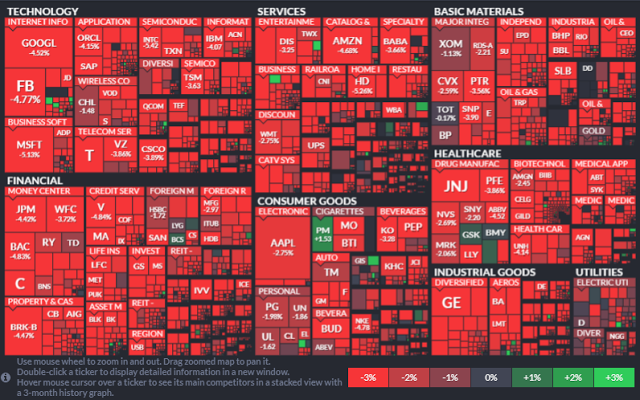
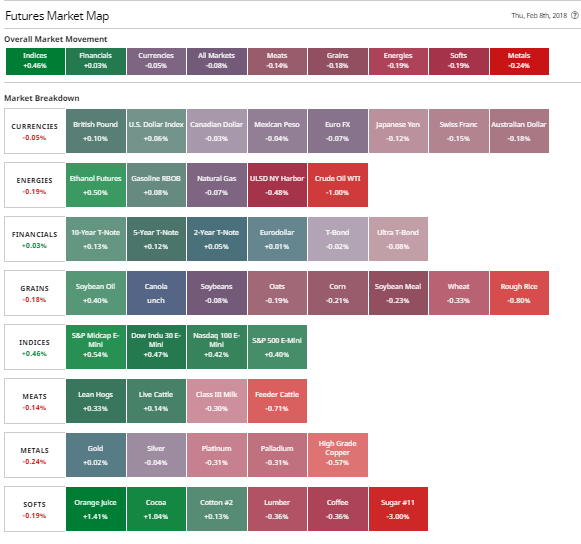
Additional graphics show today's activity for US Major Indices, Sectors and Futures Markets...
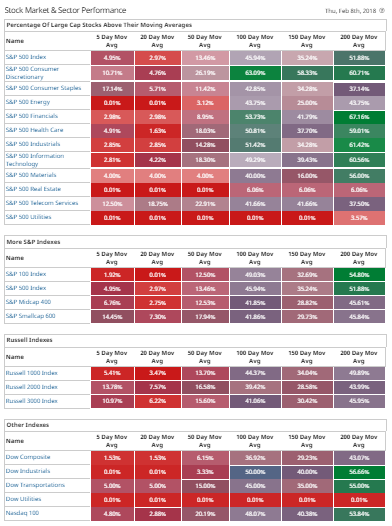
US Major Indices, Sectors and Futures Markets..

Base Materials

Futures Market Map

Finally, the MSCI World Index has dropped to its external Fibonacci retracement level of 1.618%, as shown on the monthly chart below. It has also fallen back into a long-term uptrending channel, after briefly popping above. A drop and hold below that level (2032.74) could send all world markets into a tailspin.

Keep an eye on the 60 level on the SPX:VIX ratio, as a drop and hold below could spark panic selling in the SPX. In any event, watch for more volatile swings as long as it holds below 150, and, especially, 100.
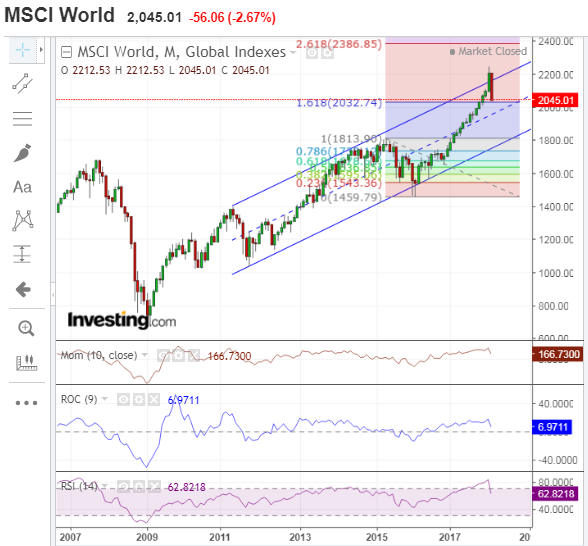
MSCI World

Latest comments

She wrote SPX was going to 3000 a couple weeks ago. Never mentioned correction
If you read my article carefully, you'll see that I never said it WOULD go to 3000, but outlined a few different scenarios, conditions and timelines whereby that MIGHT be achieved. I identified it as the next major resistance level. No doubt, you're aware that markets and conditions fluctuate from day to day and week to week. My subsequent article identified 2500 as major support for the SPX and it specified some factors that may influence such a drop. Those are the facts and they're in my articles.
terrific stuff, thx
Risk Disclosure: Trading in financial instruments and/or cryptocurrencies involves high risks including the risk of losing some, or all, of your investment amount, and may not be suitable for all investors. Prices of cryptocurrencies are extremely volatile and may be affected by external factors such as financial, regulatory or political events. Trading on margin increases the financial risks.
Before deciding to trade in financial instrument or cryptocurrencies you should be fully informed of the risks and costs associated with trading the financial markets, carefully consider your investment objectives, level of experience, and risk appetite, and seek professional advice where needed.
Fusion Media would like to remind you that the data contained in this website is not necessarily real-time nor accurate. The data and prices on the website are not necessarily provided by any market or exchange, but may be provided by market makers, and so prices may not be accurate and may differ from the actual price at any given market, meaning prices are indicative and not appropriate for trading purposes. Fusion Media and any provider of the data contained in this website will not accept liability for any loss or damage as a result of your trading, or your reliance on the information contained within this website.
It is prohibited to use, store, reproduce, display, modify, transmit or distribute the data contained in this website without the explicit prior written permission of Fusion Media and/or the data provider. All intellectual property rights are reserved by the providers and/or the exchange providing the data contained in this website.
Fusion Media may be compensated by the advertisers that appear on the website, based on your interaction with the advertisements or advertisers.
© 2007-2024 - Fusion Media Limited. All Rights Reserved.